How we built a unified observability platform for the Radware Cloud Portal, supporting Radware cloud services and the customer-facing platform services behind them, stabilized production, cut self-service failures before they reached customers, and created the foundation for AI-assisted SRE workflows.
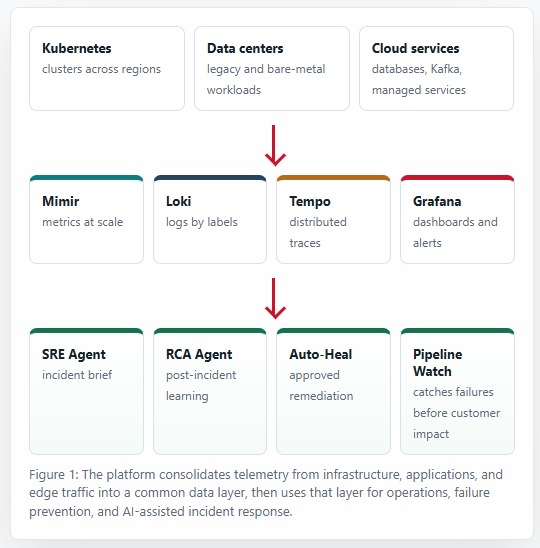
Figure 1: The platform consolidates telemetry from infrastructure, applications, and edge traffic into a common data layer, then uses that layer for operations, failure prevention, and AI-assisted incident response.
Every growing engineering organization eventually hits the same wall. Infrastructure spreads across Kubernetes clusters in multiple regions, bare-metal data centers, managed databases, Kafka pipelines, and microservices that depend on one another in ways no architecture diagram fully captures. When an incident starts, the first question is rarely "what failed?" It is usually "where do we even look first?"
For a long time, the industry answer was to keep adding tools. One for metrics, another for logs, another for tracing, another for alerting, and maybe a spreadsheet or wiki page that pretended to connect them. During incidents, engineers bounced between browser tabs, copied timestamps by hand, translated labels from one system to another, and rebuilt the same investigation context every time.
That model does not scale. It increases cost, fragments ownership, and makes on-call work harder than it needs to be. At Radware, we chose a different route: we built the observability platform behind the Radware Cloud Portal, supporting Radware cloud services along with the shared application, data, and customer-facing services they depend on, and treated observability as engineering infrastructure, not as a subscription checkbox.
The real value of observability is not in collecting more data. It is in making the right data usable at the exact moment an engineer needs to make a decision -- or, better, before they need to make one at all.
The Decision: Own the Data Model
The commercial options were easy to understand: polished dashboards, managed ingestion, attractive demos, and pricing models that become uncomfortable at real telemetry volume. At our scale, a fully managed observability SaaS would have meant millions in annual spend, plus dependency on someone else's retention model, query experience, and product roadmap.
Cost mattered, but it was not the only reason we built. The bigger reason was control. Our environment spans application delivery, cloud infrastructure, data pipelines, and customer-facing systems. We needed a platform that could absorb that diversity without forcing every team into a narrow vendor-defined model. We wanted observability that reflected how our systems actually run.
What makes this especially important at Radware is the shape of our environment. This is not an internal-only developer platform; it is the operational layer behind the Radware Cloud Portal and the underlying Radware cloud services customers rely on every day. Our platform has to connect signals across application delivery paths, data centers, Kafka pipelines, managed services, and customer-facing systems where small infrastructure changes can quickly become visible to customers. Owning the observability layer lets us model those relationships in our own language, with labels, dashboards, alerts, and workflows that reflect how Radware systems actually operate.
The Stack We Built On
The underlying stack matters, but mainly because it gave us one shared telemetry layer for metrics, logs, traces, alerting, and profiling without locking the operating model to a vendor roadmap.
| Pillar |
Tool |
Role in the Platform |
| Metrics |
Grafana Mimir |
Long-term metrics storage for infrastructure and application signals. |
| Logs |
Grafana Loki |
Searchable log context tied to the same labels and incidents. |
| Traces |
Grafana Tempo |
Request-level causality across services and dependencies. |
| Visualization, alerting, profiling |
Grafana and Pyroscope |
Shared workflows for dashboards, alerting, profiling, and investigation. |
The first visible win was consolidation. Signals from Kubernetes, data centers, databases, Kafka, ingress controllers, and services now land in one platform. Engineers can move from an alert to a dashboard, from a dashboard to logs, and from logs to traces using consistent labels and trace IDs. The platform reduces the time spent assembling context before diagnosis begins — and just as important, it keeps that context intact during an incident. When signals stay correlated instead of fragmenting across five separate tools mid-investigation, the team never loses sight of how far a failure has actually spread while they're the ones trying to contain it.
What changed operationally
We moved from tool switching to correlated prevention. The platform now reduces alert noise by 70%, watches the telemetry supply chain for silent breaks, catches Kafka and ingestion failures before customers do, flags risky self-service changes against the exact change that caused them, and gives on-call engineers an AI-assisted first response instead of a blank page.
Most observability platforms focus on system visibility. We chose to focus on operational prevention. Unlike traditional observability programs that stop at dashboards and alerting, we extended the platform into self-healing and self-service risk reduction.
Noise Reduction Is an Engineering Problem
Alert fatigue is not a side effect. It is a reliability problem. If engineers cannot trust alerts, they either ignore them or spend their cognitive energy proving that the alert is real. Neither outcome is acceptable in a production environment.
We treated alerting as a product with owners, review cycles, and quality expectations. Recording rules in Mimir pre-aggregate expensive or high-cardinality signals. Alert rules use time windows, for clauses, and multi-condition logic to avoid paging on momentary spikes. The result was a 70% reduction in alert volume while increasing confidence in the alerts that remain.
This is one of the most important lessons from the build: a good observability platform should not make everything louder. It should help the organization hear the few signals that matter.
Catching Failures Before Customers Do
The most valuable outcome of the platform was not better dashboards. It was the shift from finding out about problems from customers, or from an outage, to finding out from the platform itself — before either of those happened. In practice, that meant fewer alerts, better telemetry supply-chain monitoring, earlier Kafka failure prevention, lower self-service failure rates, and AI-assisted first response. Two patterns made that possible.
Watching the plumbing, not just the application
Some of the worst incidents in a distributed system start quietly: a Kafka consumer group falls behind and nobody notices until the backlog is unrecoverable, an access-log pipeline stops shipping and a team doesn't realize their "quiet" service is actually blind, a data center's ingestion path silently drops. None of these trip an application error rate on their own — by the time they do, the customer has already felt it.
We built health checks for the observability pipeline itself: consumer lag and throughput on the Kafka paths that carry telemetry and production traffic, freshness checks on expected log streams per data center, and alerting when a source that should be emitting data goes quiet. The platform doesn't just observe our systems, it watches its own supply chain and the infrastructure underneath it, and flags the break while it's still an internal problem, not yet a customer-facing one. The first Kafka consumer stalls we caught this way were fixed by hand, right after the alert fired, before they had a chance to turn into a customer-visible gap. Once we understood the failure pattern well enough to trust it, we turned the fix into an Auto-Heal playbook, so the same class of stall now gets remediated without waiting on a human to notice and act.
Stopping bad self-service changes at the source
A large share of production risk isn't an attack or a hardware failure, it's a routine change: a deploy, a config push, a scaling action taken by a team through self-service tooling. The platform now correlates deploy and change events with the metrics, logs, and traces that follow them, so a self-service action that starts degrading a service gets flagged against the specific change that caused it, immediately, instead of surfacing later as an unexplained incident. The trend tells the story on its own: roughly 5,000 self-service actions a year with about 25% of them failing when we started, climbing past 600,000 today with the failure rate down to 0.1% -- the two moved in step, not by coincidence.
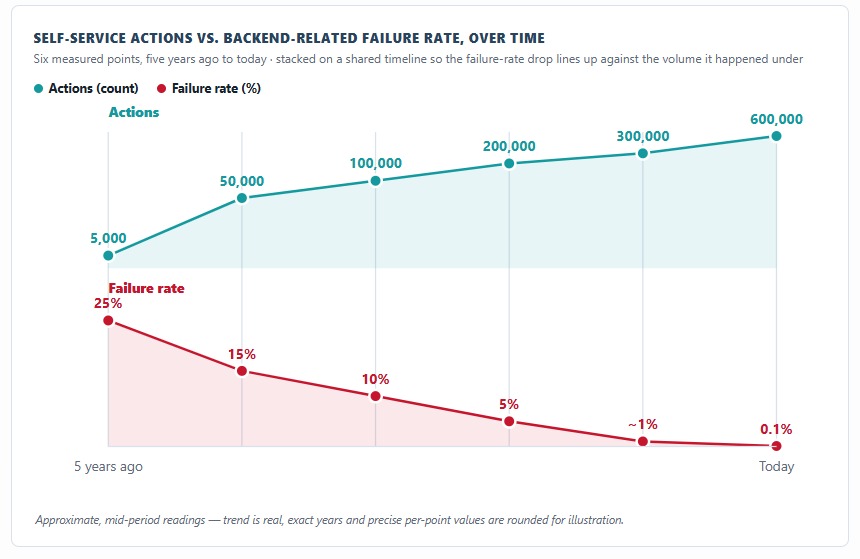
Self-service actions vs. backend-related failure rate, over time
Neither of these replaces careful engineering or code review. What they do is shrink the gap between "something went wrong" and "we know exactly what and where," from after the fact to before it matters.
Federated Ownership, Shared Platform
The cultural change was as important as the technology. Before, each team had its own monitoring language. Network teams, platform teams, and application teams each had separate tools and separate truths. Cross-layer incidents were slow because the data was separated by organizational boundary.
Today, the platform operates as shared infrastructure with federated ownership. The platform team owns the reliability and scale of the observability stack. Service teams own their dashboards, alerts, and instrumentation quality. SRE owns incident workflows and alert hygiene. The key is that all of this happens on top of one common telemetry layer.
The AI Layer: From Data to First Response
The platform became even more valuable once we added AI-assisted workflows. AI is only useful in operations when it has clean, structured, queryable data. Because we had already invested in labels, traces, dashboards, and alert discipline, we could build agents that reason over real signals instead of guessing from incomplete context.
SRE Agent: The First Investigation Draft
When an alert fires, our SRE Agent is triggered alongside the human on-call engineer. It queries Mimir for the alerting metric and nearby signals, searches Loki for errors in the relevant time window, fetches traces from Tempo, checks recent deployments, and generates a structured incident brief. The engineer receives a first investigation summary before they have manually opened five tabs.
In one common workflow, the agent identifies an out-of-memory pattern, correlates it with container restarts and memory growth, and recommends a bounded remediation. It does not silently change production. It gives the on-call engineer the evidence and the proposed action.
RCA Agent: Turning Incidents into Learning
After an incident, the RCA Agent reconstructs the timeline from metrics, logs, traces, deployment events, and known failure patterns. It drafts the post-incident analysis with evidence-linked sections: timeline, probable root cause, contributing factors, impact, and follow-up actions. Engineers review and refine instead of starting from a blank document.
Auto-Heal: Human-in-the-Loop Remediation
Our Auto-Heal system is deliberately conservative. When the SRE Agent reaches high confidence and matches a known playbook, it proposes a remediation: restart a deployment, scale a workload, roll back a canary, flush a cache, or adjust a safe operational parameter. The action requires human approval through Slack, PagerDuty, or CLI confirmation.
- Alert fires The SRE Agent gathers metrics, logs, traces, deployment context, and recent change history.
- Recommendation is generated For example: OOM detected, memory pressure confirmed, restart loop observed, safe scaling action recommended.
- Human approves The on-call engineer reviews evidence and approves or rejects the action.
- Action is executed and recorded The system deploys the approved change to the cluster, creates a ticket, sends email notification, and links the action to the incident timeline.
This design keeps accountability where it belongs. The platform removes manual investigation overhead, but the human remains in control of production change. Over time, repeated successful approvals can raise confidence for specific playbooks, but auditability and kill-switch controls remain non-negotiable.
The Economics: What We Did Not Spend, and What We Stopped Losing
Building an OSS observability platform is not free. It requires engineering effort, infrastructure capacity, storage, and ongoing maintenance. However, at our telemetry scale and retention needs, a self-managed open-source approach offers a more sustainable cost model than comparable commercial SaaS options.
More importantly, those savings are not simply removed from the budget. They are reinvested into the platform engineering capability that improves the system: better alerting, stronger correlation, AI-assisted incident response, and the pipeline and self-service checks described above. The result is not just lower tooling cost. It is a different operating posture: fewer preventable pages, fewer silent telemetry failures, fewer customer-facing regressions from routine changes, and faster first response when something still breaks.
What We Learned
Building is not always better than buying. The right answer depends on scale, engineering maturity, and appetite for platform ownership. For us, building was the right choice because observability is too central to outsource entirely.
- Start with fundamentals. Grafana and Prometheus literacy matter before scaling to Mimir, Loki, and Tempo. Teams that understand PromQL and LogQL operate the platform better.
- Label discipline is everything. Inconsistent labels create friction everywhere: dashboards, alerts, logs, traces, and AI workflows. OpenTelemetry Collector pipelines and CI checks help enforce conventions early.
- Alerting needs ownership. Alerts should have owners, quality expectations, and regular review. Alert fatigue is a platform failure, not an on-call personality issue.
- Watch the plumbing, not just the app. The pipelines that carry your telemetry and traffic can fail silently. Treat them as production systems with their own health checks, not as infrastructure you assume just works.
- AI needs high-quality telemetry. The SRE Agent is only as useful as the data it can query. Structured logging, semantic tracing, and consistent labels are prerequisites, not enhancements.
The Takeaway
Observability is not a product you buy once and forget. It is a discipline you build into the way engineering operates. The tools are available and production-proven. The real investment is in the data model, ownership model, alert quality, and workflows that turn telemetry into decisions -- ideally decisions made before a customer ever notices something was wrong.
None of this was built by one team in isolation. It happened because SRE and Dev worked back to back, close enough that each side kept improving its own domain in step with the other: Dev shaping the services and instrumentation, SRE shaping the platform and the guardrails around them. That tight loop, not any single tool, is what turned telemetry into fewer surprises.
For Radware, observability is not only about internal reliability; it is about protecting the operational paths that customers depend on every day across the Cloud Portal and the services behind it.
If your platform still treats observability as a reporting layer, start by owning the data model around the customer paths that matter most. Standardize labels, connect metrics, logs, traces, and change events, and build workflows that help engineers act before customers are impacted.
That is the point where observability stops being a dashboard project and becomes an operational control plane for risk reduction.