What are Application Performance Tools?
Application performance tools are software solutions that monitor, measure, and analyze how applications perform in real time. They track metrics such as response times, error rates, throughput, and resource usage to identify bottlenecks or failures. These tools help ensure that applications meet expected performance standards across environments and user conditions.
Organizations use these tools for multiple reasons: to ensure business continuity by minimizing downtime, to enforce service-level agreements (SLAs) with measurable data, and to continuously improve user experience (UX). They provide clear visibility into where and why performance problems occur, helping to prioritize fixes that have the highest business impact.
As applications grow more distributed, ephemeral, and user-centric, the role of application performance has shifted from basic uptime tracking to strategic observability. Performance is now tightly coupled with business outcomes, requiring teams to monitor not just infrastructure health, but also user journeys, service dependencies, and deployment impacts.
The shift toward cloud-native architectures, edge computing, and real-time data has made continuous performance optimization a core requirement, not a reactive task. Modern APM tools must support this evolution by delivering real-time, correlated insights across systems, users, and code—with minimal manual effort.
Editor's note: This article has been updated to include recent market trends and information about application security tools to reflect features and capabilities in 2026.
In this article:
Market Growth and Outlook
The application performance management (APM) market is experiencing steady growth as organizations become increasingly dependent on digital services, cloud applications, and distributed software architectures. The market was valued at USD 9.42 billion in 2025 and is projected to reach USD 24.14 billion by 2034, growing at a CAGR of 11.2% during the forecast period.
North America held the largest market share in 2025, accounting for nearly 38% of global revenue. Growth is being driven by the need for real-time visibility into application performance, customer experience, and business-critical digital services. As organizations continue to modernize their IT environments, APM platforms are becoming an essential component of operational and business performance management.
The Shift Toward Full-Stack Observability
Traditional application monitoring tools are often unable to provide visibility across modern environments that include cloud platforms, microservices, containers, APIs, and third-party services. As a result, organizations are increasingly adopting full-stack observability platforms that combine logs, metrics, and traces into a unified monitoring environment.
This trend enables development and operations teams to identify root causes more quickly, reduce downtime, and maintain consistent performance across hybrid and multi-cloud infrastructures. Vendors are expanding their platforms beyond monitoring to deliver broader observability capabilities that provide end-to-end visibility into application ecosystems.
Growing Role of AI and Generative AI
Artificial intelligence is becoming a major driver of innovation in the APM market. Modern platforms use AI-powered analytics to automate anomaly detection, performance optimization, and root-cause analysis, helping teams identify issues before they affect users.
The emergence of generative AI is further transforming the market by enabling predictive monitoring and intelligent insights. By analyzing large volumes of telemetry data, generative AI can forecast potential performance problems, automate investigations, and provide natural-language explanations of system behavior. These capabilities help organizations move from reactive troubleshooting to proactive performance management.
Adoption of Hybrid and Multi-Cloud Environments
The rapid growth of hybrid and multi-cloud architectures is increasing demand for unified application performance management solutions. Organizations now operate applications across multiple cloud providers, on-premises infrastructure, and edge environments, making performance monitoring significantly more complex.
APM platforms are evolving to address these challenges by providing centralized visibility across distributed environments. Organizations are investing in solutions that can monitor application performance, infrastructure health, network activity, APIs, and external dependencies from a single interface.
Integration With Cloud and DevOps Ecosystems
A key market trend is the growing integration between APM platforms and cloud-native development tools. Vendors are forming partnerships and building integrations with cloud providers, container orchestration platforms, CI/CD pipelines, and incident management systems.
These integrations enable performance data to flow seamlessly across development, deployment, and operations workflows. As a result, organizations gain greater visibility into application behavior throughout the software lifecycle while accelerating troubleshooting and improving release reliability.
Modern APM tools come equipped with a range of features for application monitoring. From distributed tracing to synthetic monitoring, each feature addresses different aspects of performance. Here is a breakdown of key features.
Device Health Monitoring
Device health monitoring focuses on the underlying infrastructure that supports an application, including servers, containers, virtual machines, and network appliances. Metrics such as CPU utilization, memory allocation, disk I/O throughput, and network packet loss are collected at short intervals.
Advanced APM tools can trigger alerts when thresholds are exceeded, automatically scale resources, or initiate failover procedures. Continuous device monitoring ensures that hardware-level constraints do not cascade into application performance issues. In hybrid or multi-cloud deployments, device health monitoring also integrates with cloud provider APIs to track virtual resource health in real time.
Application and ADC Visibility
Application visibility covers how each application tier (frontend, middleware, and backend) handles user requests. This includes transaction flow mapping, request queuing, and database query performance. ADC visibility extends this by analyzing the role of load balancers, application firewalls, and content delivery networks in distributing and securing traffic.
APM tools can expose issues such as uneven load balancing, SSL handshake delays, or session persistence misconfigurations. This combined visibility is especially important in environments using API gateways or edge delivery systems, where misconfigurations can silently degrade performance.
Real-Time Metrics Collection
Real-time metrics collection enables second-by-second insight into application health. Metrics are usually ingested via lightweight agents or API endpoints that feed into a time-series database. Collected data includes latency distributions, HTTP status code breakdowns, garbage collection activity, and service-to-service call durations.
Some APM platforms also apply in-memory analytics to identify latency spikes or throughput drops immediately. Low-latency metrics pipelines allow operational teams to make rapid changes, such as adjusting autoscaling policies or throttling non-essential background jobs during peak load.
Synthetic Monitoring
Synthetic monitoring uses scheduled, automated scripts to simulate user transactions under controlled conditions. These scripts mimic actions such as logging in, searching for a product, or completing a checkout process. Synthetic checks are performed from multiple geographic locations to measure latency, page load times, and availability from different user regions.
Advanced implementations can inject artificial network delays or packet loss to test application behavior under suboptimal conditions. Unlike RUM, synthetic monitoring is proactive; issues can be identified even during periods of low or no real traffic.
User Experience Monitoring (RUM)
Real user monitoring passively collects data from actual user sessions, typically by injecting JavaScript into web pages or using SDKs for mobile applications. It captures load times for key assets, input responsiveness, error messages, and network delays from the end user’s perspective.
RUM data is segmented by device type, browser, operating system, network provider, and geographic region. This allows performance optimization efforts to be targeted where they have the greatest impact; for example, addressing issues that only occur for mobile users in high-latency regions.
Distributed Tracing
Distributed tracing assigns a unique identifier to each request and tracks it as it passes through different services, queues, and databases. Each hop in the request path records timing data and contextual metadata, allowing the complete execution timeline to be reconstructed.
This technique is essential for debugging microservices architectures, where a single request may touch dozens of components. Traces can reveal slow service-to-service calls, excessive retries, or serialization delays. They also help confirm whether an upstream issue is causing downstream bottlenecks.
Log Correlation and Analysis
Log correlation combines application logs, infrastructure logs, and security event logs with performance metrics and traces to provide full-context incident investigation. By correlating timestamps and request IDs, teams can pinpoint the exact log entries relevant to a performance spike.
Modern APM tools offer structured log ingestion, enabling filtering and search on fields such as user ID, transaction ID, or API endpoint. This drastically reduces time-to-resolution by avoiding manual log file review across multiple servers.
Root Cause Analysis and Anomaly Detection
Root cause analysis (RCA) uses dependency maps, event timelines, and correlation between metrics and logs to determine why a performance issue occurred. Anomaly detection complements RCA by identifying deviations from normal behavior before they trigger alerts.
This is often achieved through statistical baselining or machine learning models that learn normal traffic patterns and resource utilization levels. When anomalies occur, such as a sudden spike in 500 errors or unusual query response times, teams are notified with context-rich diagnostics.
Application Analytics
Application analytics go beyond raw performance monitoring to provide insights into usage trends, transaction throughput, user journey flows, and feature adoption. Data can be sliced by customer segment, time of day, or application version.
This information informs both operational decisions, such as which transactions to optimize, and business strategies, like which features to prioritize. APM-integrated analytics allow organizations to measure the performance impact of new releases or infrastructure changes over time.
Centralized Dashboards
Centralized dashboards aggregate metrics, logs, traces, and alerts into a unified visual interface. They often support custom views for different teams: developers may focus on service-level metrics, while operations may track infrastructure health. Many dashboards include real-time charts, heatmaps, and service dependency diagrams.
This reduces context-switching and ensures all stakeholders share the same situational awareness during performance incidents. Integration with collaboration tools allows alerts and visualizations to be shared instantly with response teams.
Related content: Read our guide to application performance optimization.
A variety of APM tools exist, each offering a unique set of features to cater to different organizational needs. Here is an overview of some of the leading options.
Application-Centric APM and Specialized Performance Tools

Radware Alteon Cloud Control is an application delivery controller (ADC) management and performance tool that provides centralized visibility, automation, and analytics across hybrid and multicloud infrastructure. It enables organizations to deploy, monitor, and optimize application delivery and security services with consistent policies and performance standards—without needing deep ADC expertise.
Key features include:
- Multi-cloud deployment visibility: Monitors ADC service health, capacity, and performance across public, private, and on-prem environments.
- Real-time analytics and dashboards: Offers performance metrics per application, latency, resource utilization, and alerts for anomalies across delivery paths.
- Global Elastic License (GEL): Dynamically adjusts ADC capacity and licensing across environments to match actual usage, reducing over-provisioning
- Automation and self-service provisioning: Allows scaling infrastructure and deploying new delivery/security services with minimal manual intervention.
- Root cause insights: Correlates application delivery performance with infrastructure and network parameters to help quickly identify bottlenecks or latency sources.

ManageEngine Applications Manager is an application performance monitoring and observability solution that provides visibility across application stacks, including infrastructure, databases, and user interactions. It supports monitoring in development and production environments, combining code-level diagnostics, distributed tracing, and dependency mapping. The platform also includes real user and synthetic monitoring to track performance.
Key features include:
- Full-stack monitoring: Tracks applications, servers, databases, and cloud resources from a single platform.
- Distributed tracing and code diagnostics: Provides transaction tracing and code-level insights to identify performance bottlenecks.
- Real user monitoring: Captures frontend performance metrics across devices, browsers, and geographies.
- Synthetic transaction monitoring: Simulates user workflows to detect issues proactively across locations.
- Log and database monitoring: Correlates logs and database queries with performance metrics for faster troubleshooting.
- Automated discovery and dependency mapping: Maps relationships between services and infrastructure in real time.
- AI-powered alerts and analytics: Uses anomaly detection, thresholds, and forecasting to identify and predict issues.

Raygun is an application performance monitoring tool focused on providing visibility into server-side performance and code execution. It emphasizes trace-level diagnostics, allowing teams to understand how requests move through applications and where delays occur. The platform integrates performance monitoring with error tracking and real user monitoring to give a unified view of application health and user impact.
Key features include:
- Code-level tracing: Breaks down request execution by methods, queries, and external calls for precise diagnostics.
- Real-time issue detection: Identifies performance problems and filters them by impact, frequency, and affected users.
- Visual trace analysis: Provides detailed, expandable views of execution paths, including asynchronous processes.
- Custom issue rules: Allows detection of patterns such as inefficient queries or excessive API calls.
- Integrated monitoring suite: Combines APM with real user monitoring and crash reporting for full visibility.
- Custom dashboards and trends: Tracks performance metrics, errors, and user activity over time.
Observability Platforms

Dynatrace is an observability platform that combines application, infrastructure, and user experience monitoring with AI-driven analytics. It collects and analyzes telemetry data across environments and uses automated intelligence to detect anomalies and determine root causes. The platform supports modern architectures, including cloud-native systems and AI-enabled applications, and provides insights with minimal manual configuration.
Key features include:
- AI-driven observability: Uses deterministic AI to detect anomalies and identify root causes automatically.
- Unified data platform: Correlates metrics, logs, and traces within a single data lakehouse.
- Real-time insights and automation: Enables automated responses and proactive issue prevention.
- Full-stack visibility: Monitors applications, infrastructure, and digital experience across environments.
- Support for modern workloads: Covers cloud-native systems, containers, and AI-driven applications.
- Integrated automation capabilities: Reduces manual effort through automated workflows and agent-based operations.
New Relic is a full-stack observability platform that provides visibility into applications, infrastructure, and user experiences, with increasing focus on AI-driven systems. It consolidates telemetry data into a unified view and connects performance metrics with business outcomes such as revenue and user engagement. The platform also supports monitoring of AI systems and agent-based workflows.
Key features include:
- Full-stack observability: Combines APM, infrastructure monitoring, logs, and digital experience data.
- AI and agent monitoring: Tracks behavior, performance, and usage of AI models and agents.
- OpenTelemetry support: Uses open standards for collecting and integrating telemetry data.
- Business impact correlation: Links application performance to revenue and user experience metrics.
- Integrated dashboards and insights: Provides unified views across services, agents, and dependencies.
- Extensive integrations: Supports hundreds of integrations across cloud services and tools.
Splunk AppDynamics is an observability platform that connects application performance with business outcomes. It provides visibility across hybrid and on-prem environments, using AI and machine learning to detect anomalies and identify root causes. The platform emphasizes business transaction monitoring, allowing teams to understand how performance issues impact key workflows and revenue.
Key features include:
- Business transaction monitoring: Tracks critical user flows such as logins and purchases.
- Full-stack observability: Correlates application, infrastructure, and network performance data.
- AI-driven anomaly detection: Identifies deviations from normal behavior and highlights root causes.
- Digital experience monitoring: Measures user interactions across web, mobile, and APIs.
- Network and dependency visibility: Analyzes the impact of third-party services and infrastructure.
- Flexible telemetry collection: Supports agents and open standards for data ingestion.

Datadog APM is a cloud-based application performance monitoring solution that provides visibility into distributed systems. It uses distributed tracing and correlates telemetry data across logs, metrics, and user interactions to help teams identify performance issues. The platform includes AI-driven capabilities for anomaly detection and root cause analysis, supporting rapid troubleshooting in complex environments.
Key features include:
- Distributed tracing with code-level visibility: Tracks requests across services, including execution at method and thread level.
- Telemetry correlation: Combines traces with logs, metrics, and real user monitoring data.
- AI-powered anomaly detection: Uses machine learning to identify issues and surface root causes.
- Change tracking: Links performance issues to deployments, configuration changes, and releases.
- Custom dashboards and SLOs: Enables monitoring of service-level objectives and business metrics.
- Flexible instrumentation: Supports agent-based and OpenTelemetry-based data collection.
Elastic APM is part of the Elastic Stack and provides real-time monitoring of applications and services by collecting performance data. It tracks request latency, database queries, external calls, and errors, allowing teams to identify performance issues quickly. Integration with the broader Elastic ecosystem enables correlation with logs and infrastructure metrics.
Key features include:
- Performance monitoring: Tracks response times, request flows, and service interactions.
- Error and exception tracking: Automatically captures and groups errors based on stack traces.
- Metrics collection: Gathers host-level and application-specific metrics for analysis.
- Distributed tracing support: Monitors requests across services and dependencies.
- Integration with Elastic Stack: Correlates APM data with logs and infrastructure monitoring.
- OpenTelemetry compatibility: Supports standardized telemetry collection.

SolarWinds Observability is a SaaS-based platform that provides unified visibility across applications, infrastructure, and networks in cloud, hybrid, and on-prem environments. It consolidates telemetry data into a single interface and applies analytics to detect anomalies and reduce alert noise. The platform is intended to support DevOps, IT operations, and cloud teams with shared insights.
Key features include:
- Unified full-stack visibility: Monitors applications, infrastructure, databases, and networks in one platform.
- AI-powered anomaly detection: Filters noise and highlights meaningful deviations affecting system health.
- Hybrid and multi-cloud support: Provides visibility across cloud-native and on-prem environments.
- Transaction tracing and profiling: Enables code-level troubleshooting and performance analysis.
- Real and synthetic user monitoring: Tracks user experience and simulates transactions.
- Extensive integrations: Connects with cloud services, databases, and third-party tools.
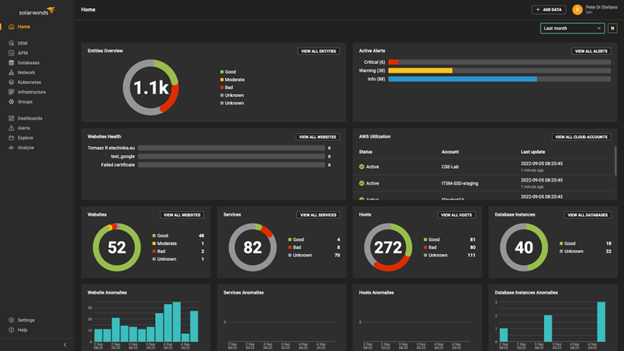
Source: SolarWinds
IBM Instana is an observability platform that uses automation and AI to monitor application performance across complex environments. It continuously collects high-resolution telemetry data and automatically maps dependencies between services. The platform emphasizes real-time insights and automated incident investigation to reduce time to resolution.
Key features include:
- Automated observability: Continuously collects and analyzes full-stack telemetry without manual setup.
- Real-time data collection: Provides second-by-second updates for accurate performance monitoring.
- AI-driven incident investigation: Uses automation to identify root causes and accelerate resolution.
- Dependency mapping: Tracks relationships between services and infrastructure components.
- Digital experience monitoring: Measures user interactions and application performance.
- Broad technology support: Covers hundreds of platforms and integrates across diverse environments.
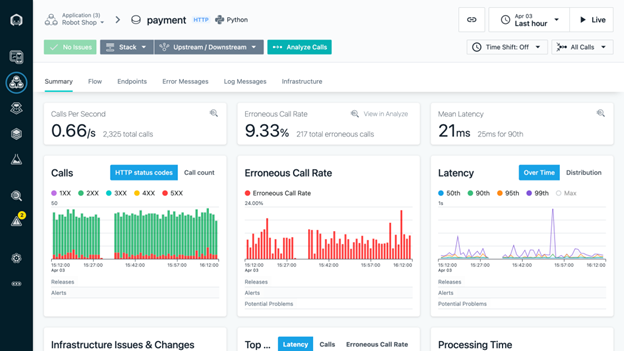
Source: IBM Instana
Conclusion
APM tools are essential for maintaining the performance and reliability of modern software systems. By providing deep visibility into application behavior, they empower teams to identify and resolve issues quickly, optimize resource utilization, and deliver high-quality user experiences.