The year 2025 has proven to be a watershed moment in the history of cybersecurity, a period we described as a digital Garden of Eden for threat actors. While the metaphor suggested a paradise of opportunity for our adversaries, it represented a fundamental paradigm shift for many defenders. The 2026 report was not just a collection of data points; it was a call to action. To survive the new reality, organizations must abandon the reactive assumptions of the last decade and embrace proactive, self-defending architectures built on the pillars of automation, scale and intelligence.
Are the defining trends that shaped the 2025 landscape confirmed in the first quarter of 2026?
Web DDoS Attack Activity
Web DDoS activity underwent a transformative shift in 2025 marked by an escalation in both scale and frequency of attacks. By year’s end, Web DDoS activity had surged by 101.4% compared to 2024, firmly establishing the application layer as the primary battleground for modern cyber threats. This growth was far from linear; while the first half of 2025 saw a substantial 38.5% increase over the previous six months, the momentum intensified as the year progressed. This acceleration peaked in the second half of the year, which demonstrated a formidable 54.5% spike compared to the first half.
The trend has only gained strength moving into 2026, with the first quarter showing an even more aggressive trajectory. Q1 of 2026 recorded a 34.7% increase in activity over the final quarter of 2025. Most strikingly, when compared to the same period a year prior, the total number of Web DDoS attacks in Q1 2026 increased by 187.1%, signaling a sustained and intensifying era of digital disruption.
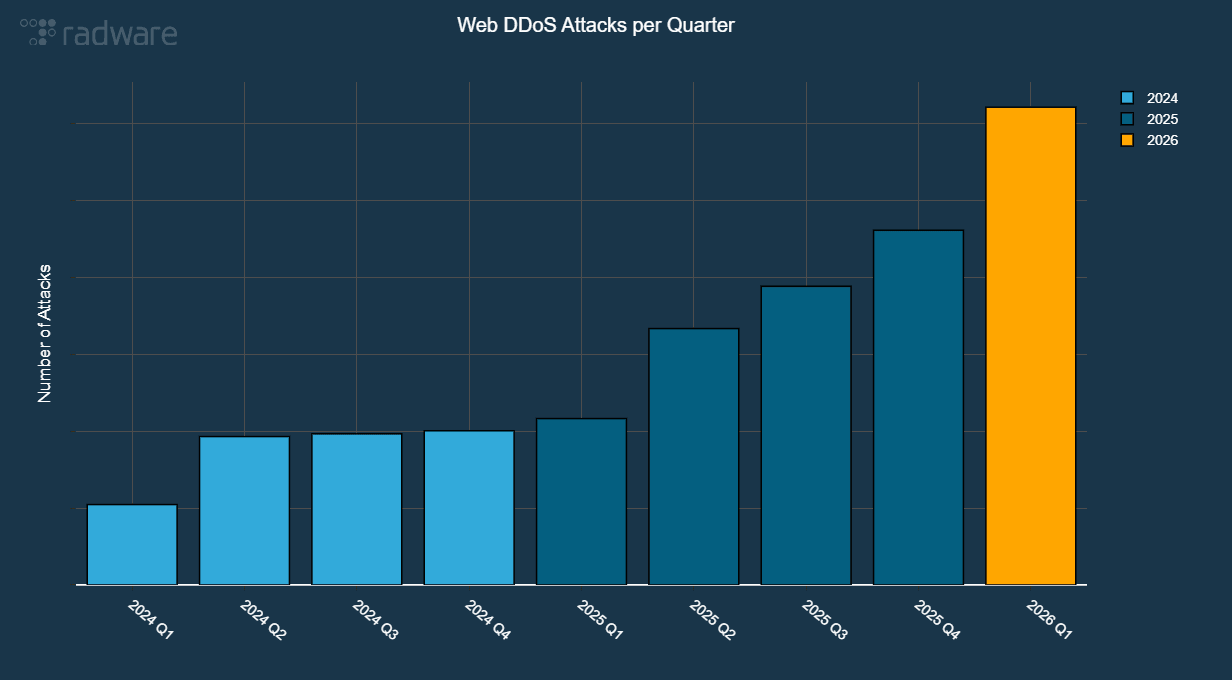
Figure 1: Evolution of Web DDoS attacks mitigated per quarter (source: Radware)
The size distribution of Web DDoS attacks mitigated in the first quarter of 2026 closely mirrors the patterns established throughout 2025. According to our data, the vast majority of these incidents remain under 50,000 requests per second (RPS), while larger attacks are distributed evenly across higher volume ranges.
This trend highlights a strategic shift by advanced threat actors, who increasingly favor smaller, sustained attacks to bypass traditional threshold-based detection. In Q1 2026, events under 100,000 RPS constituted 93% of all recorded activity. Meanwhile, high-intensity attacks exceeding 5 million RPS now account for only 1% of total number of attacks, down from 4% in 2024. This shift indicates a decline in their relative share of overall activity rather than a reduction in actual frequency. Extreme Web DDoS attacks exceeding 10 million RPS persist as a significant component of the modern threat landscape.
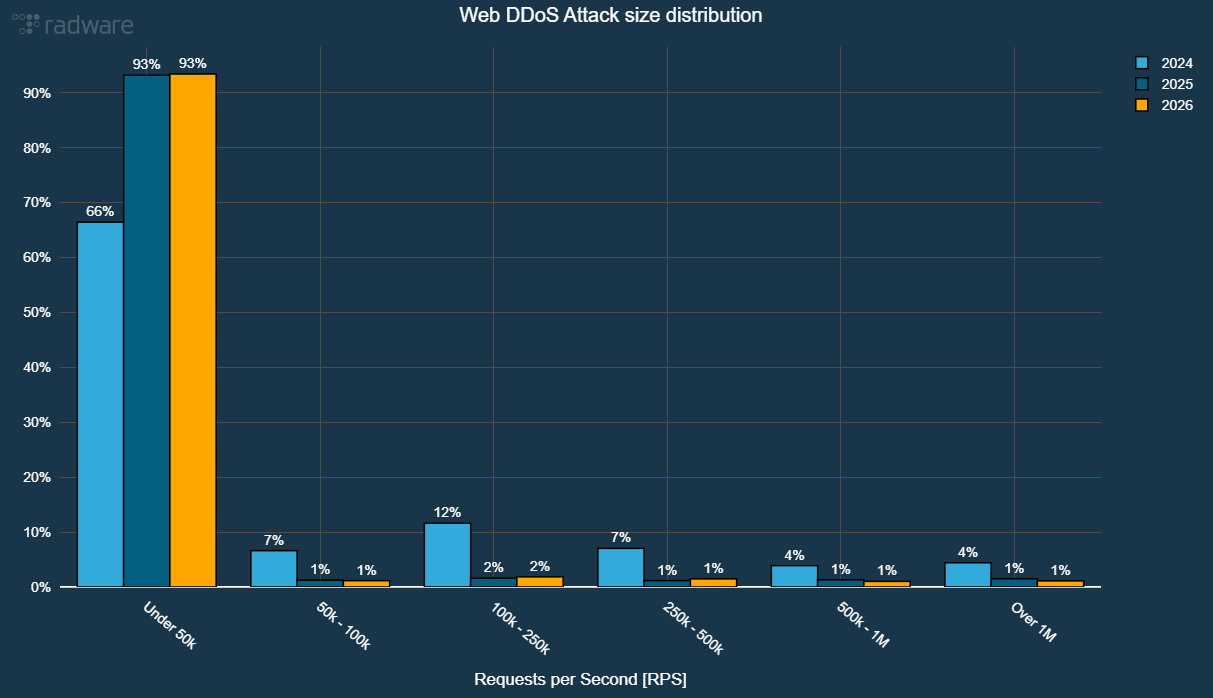
Figure 2: Web DDoS attack size (RPS) distribution per year (source: Radware)
In the first quarter of 2026, EMEA accounted for more than half of the Web DDoS attack activity, followed by APAC and US each representing about 20% of the activity. CALA represented 6.5% of the Web DDoS activity.
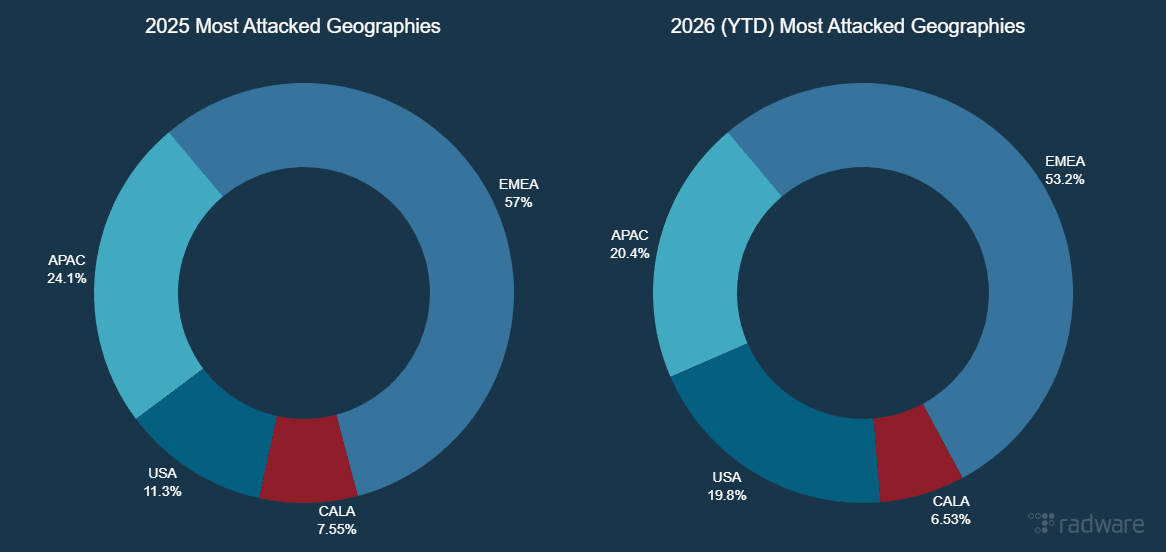
Figure 3: Geographic distribution of Web DDoS attack activity (source: Radware)
Network DDoS Attack Activity
In 2025, an aggressive growth in network DDoS attacks combined with a surge in Web DDoS activity to form what I called a “pincer movement” in the threat landscape. The number of mitigated network DDoS attacks per customer decreased slightly by 17% in Q1 of 2026 compared to Q4 of 2025. Compared to the same period last year, the number of attacks per customer increased by 107% in Q1 2026.
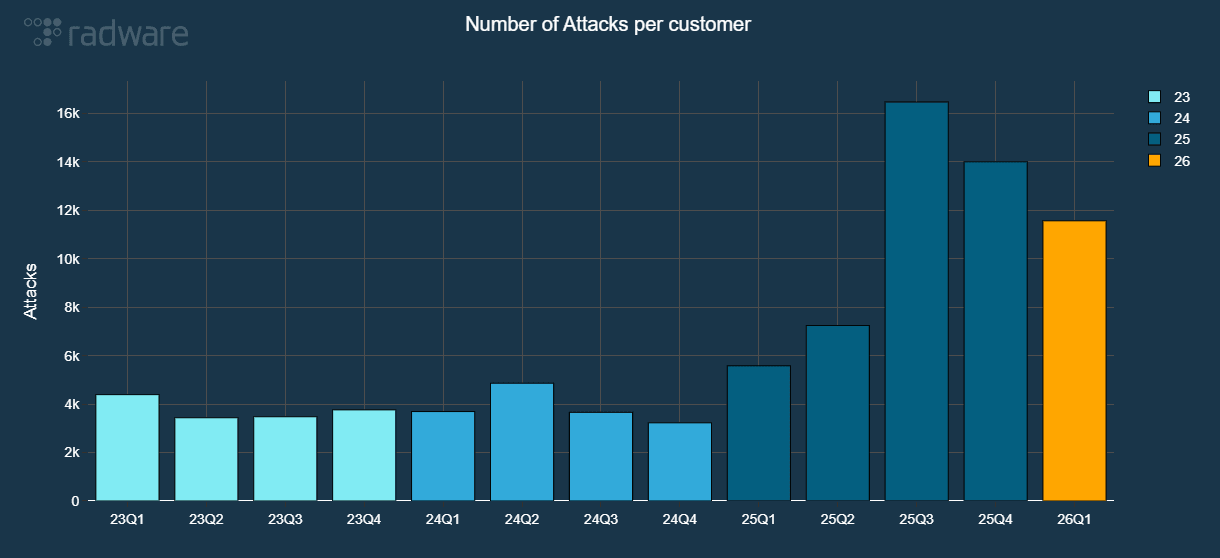
Figure 4: Evolution of network DDoS attacks normalized per customer (source: Radware)
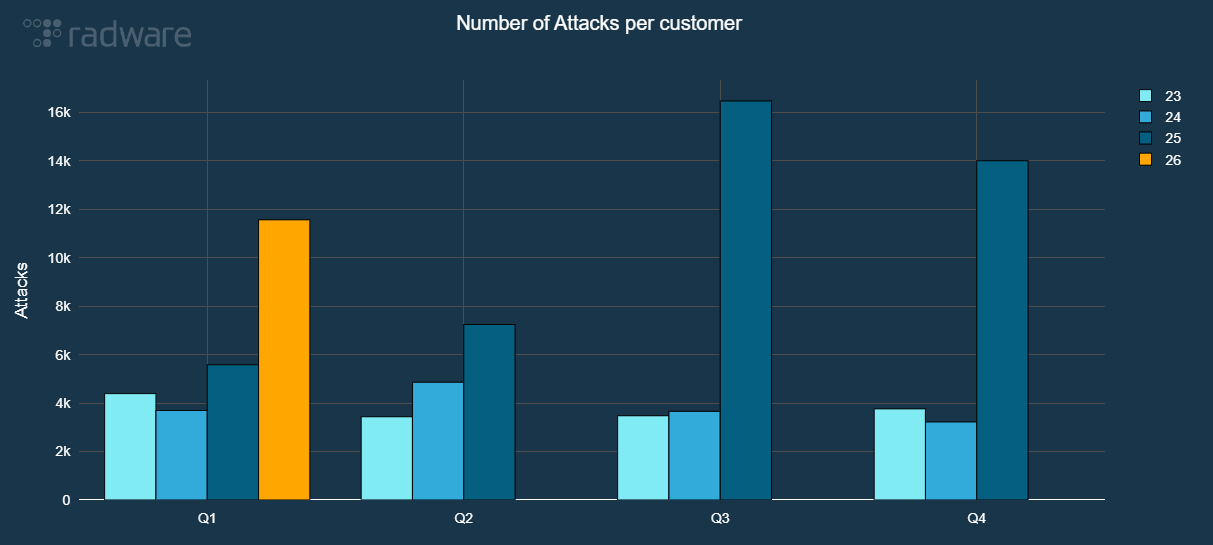
Figure 5: Network DDoS attacks per quarter normalized per customer (source: Radware)
The number of network DDoS attacks per customer mitigated in the first quarter of 2026 has already surpassed the total number of attacks per customer recorded throughout the entire year of 2024. Furthermore, the activity in Q1 2026 alone accounts for nearly 40% of the total number of network DDoS attacks per customer observed during all of 2025.
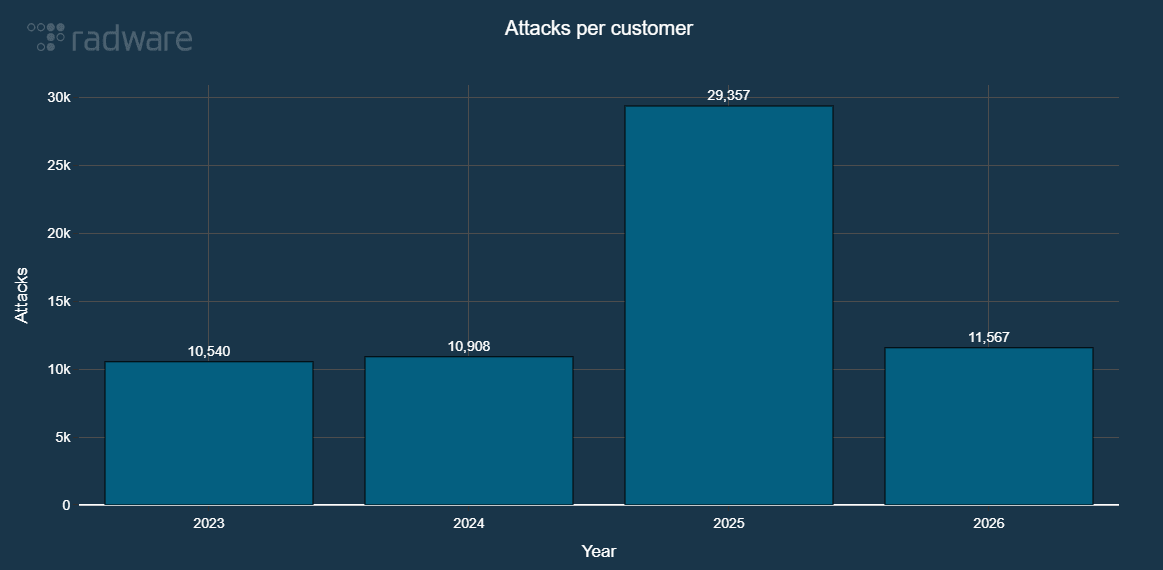
Figure 6: Evolution of network DDoS attacks normalized per customer, per year (source: Radware)
In Q1 2026, intrusions represented 60.1% of all blocked network events, Denial of Service (DoS) events represented 37% and Radware ERT Active Attackers Feed (EAAF) blocked almost 3% of all network attack events. In 2025, intrusions represented 52.1% versus 46% DoS events and 1.2% EAAF mitigated events.
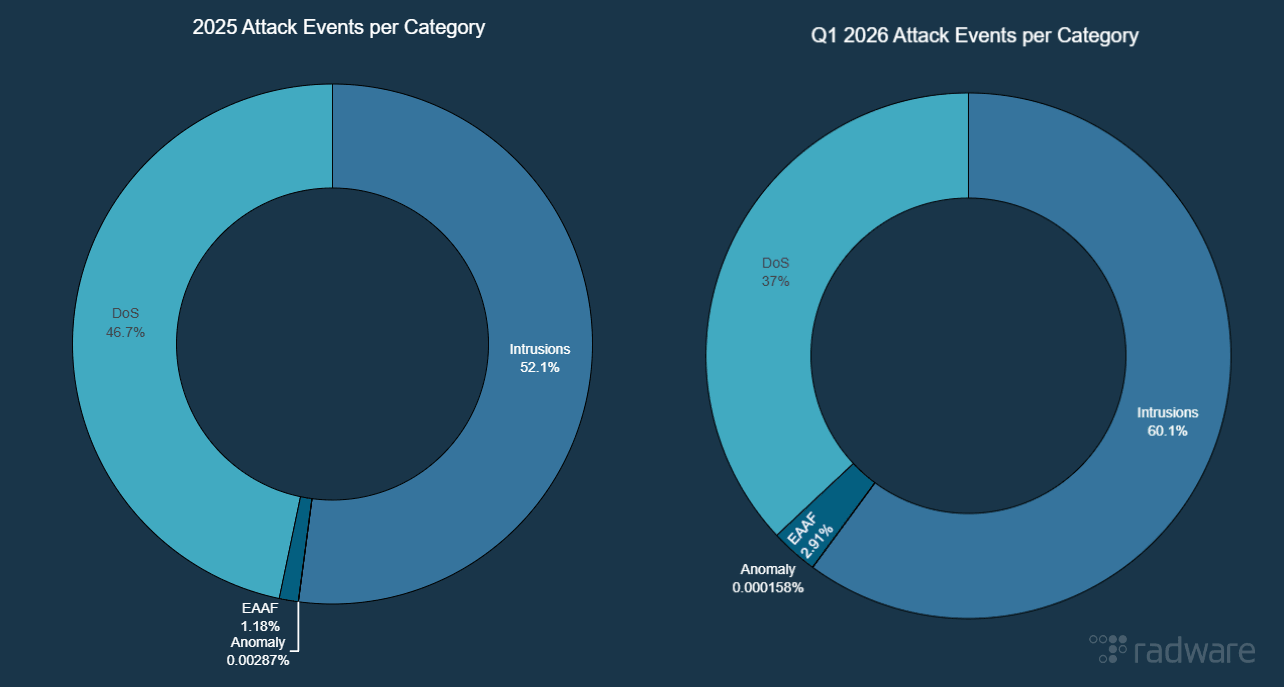
Figure 7: Network attack event distribution (source: Radware)
Web Application and API Attack Activity
The explosive growth in malicious web application and API transactions throughout 2025 represented a critical shift in the threat landscape, signaling that attackers fully industrialized their exploitation of the application layer. The number of malicious web and API transactions blocked by our Cloud Protection Services continued to accelerate as our data indicates an increase of 52% in Q1 2026 compared to Q4 2025. Compared to the same period last year, the number of blocked transactions was up by 273% in Q1 2026.
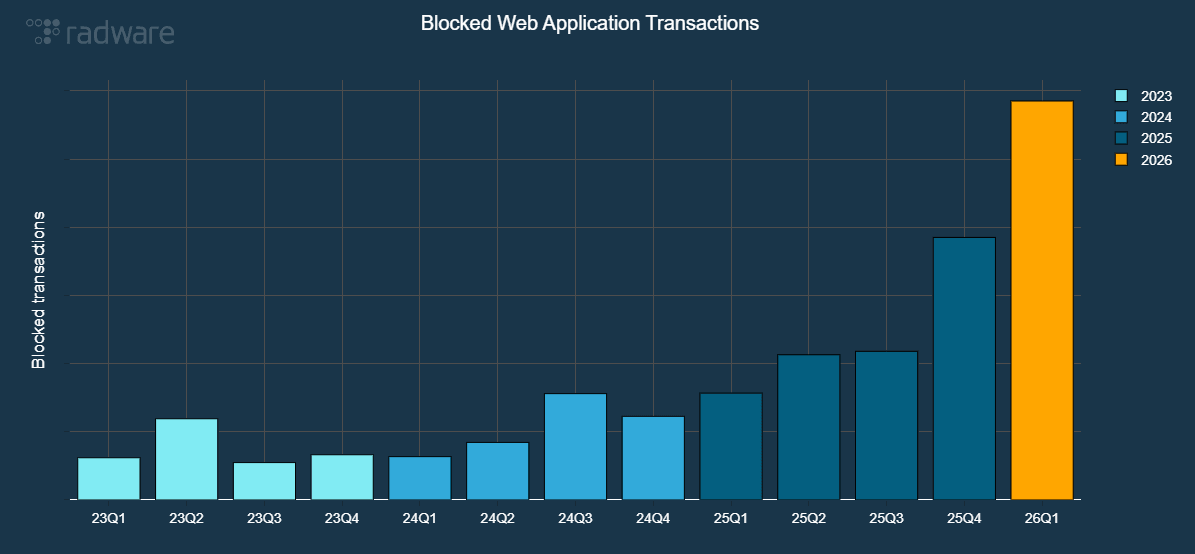
Figure 8: Malicious web application and API transactions evolution (source: Radware)
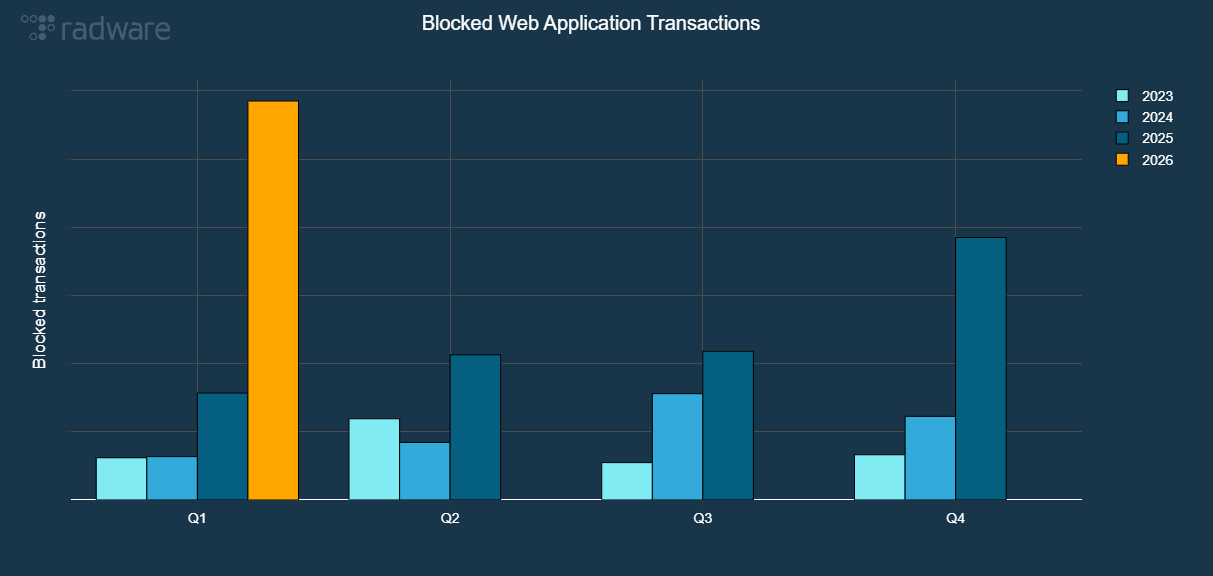
Figure 9: Malicious web application and API transactions per quarter (source: Radware)
The number of malicious web application and API transactions blocked in Q1 2026 alone represents already 60% of all transactions blocked throughout 2025.
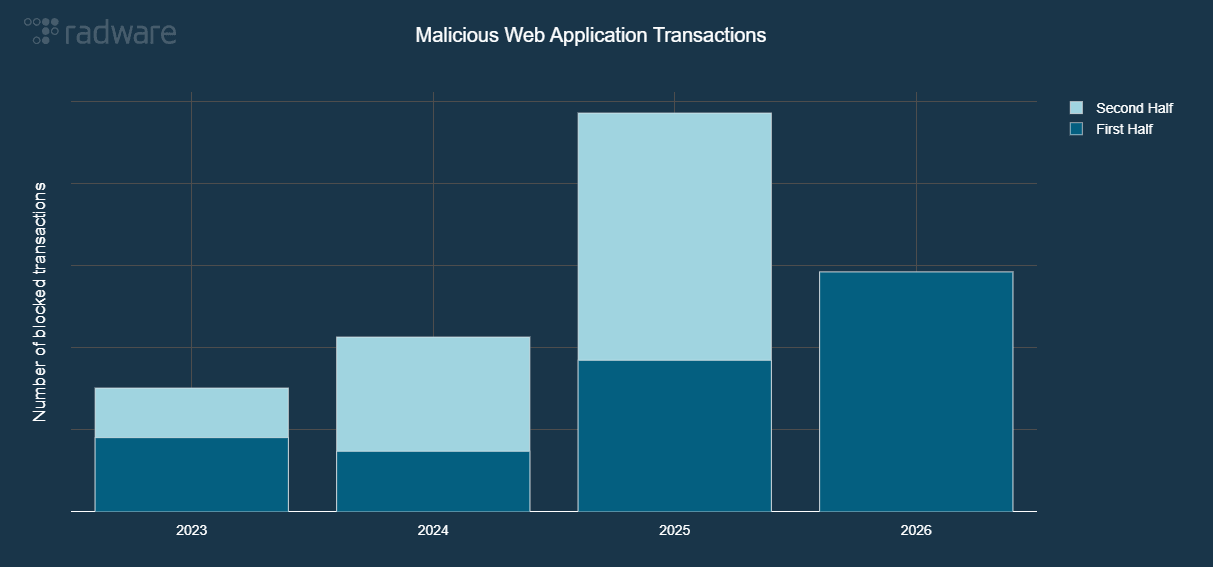
Figure 10: Malicious web application and API transactions per year (source: Radware)
The strategic pivot towards exploitation that was observed in the second half of 2025 accelerated in Q1 2026. Vulnerability exploitations represented almost 62% of all blocked attack attempts.
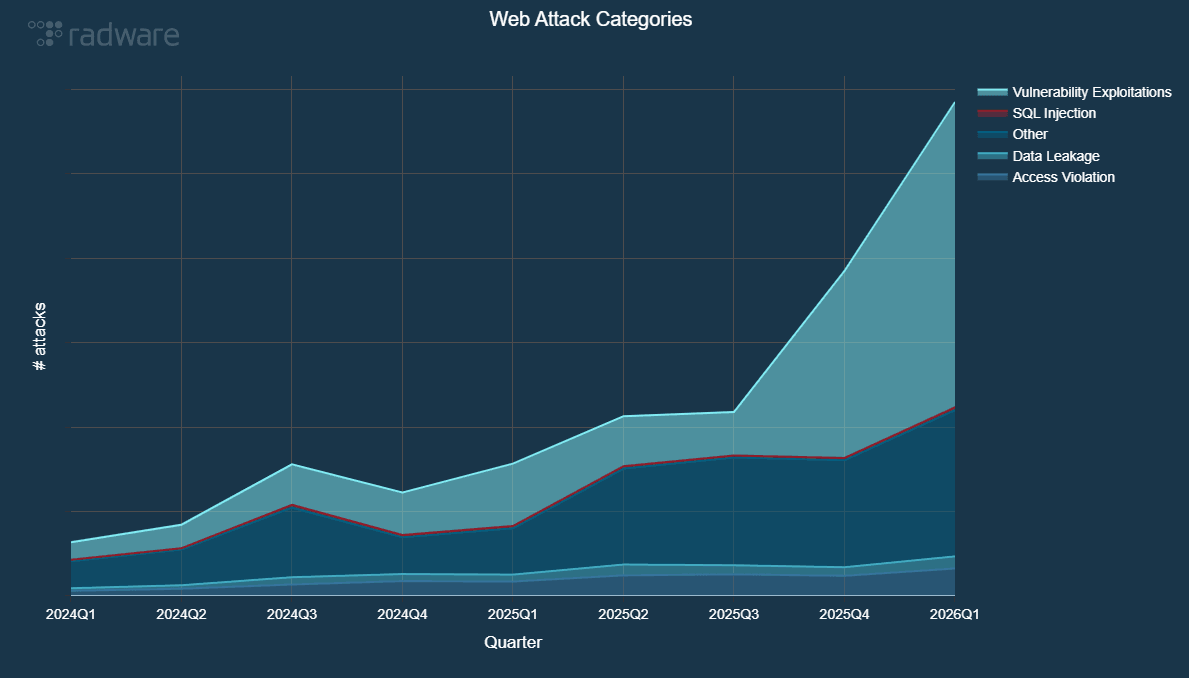
Figure 11: Evolution of web application and API attack categories (source: Radware)
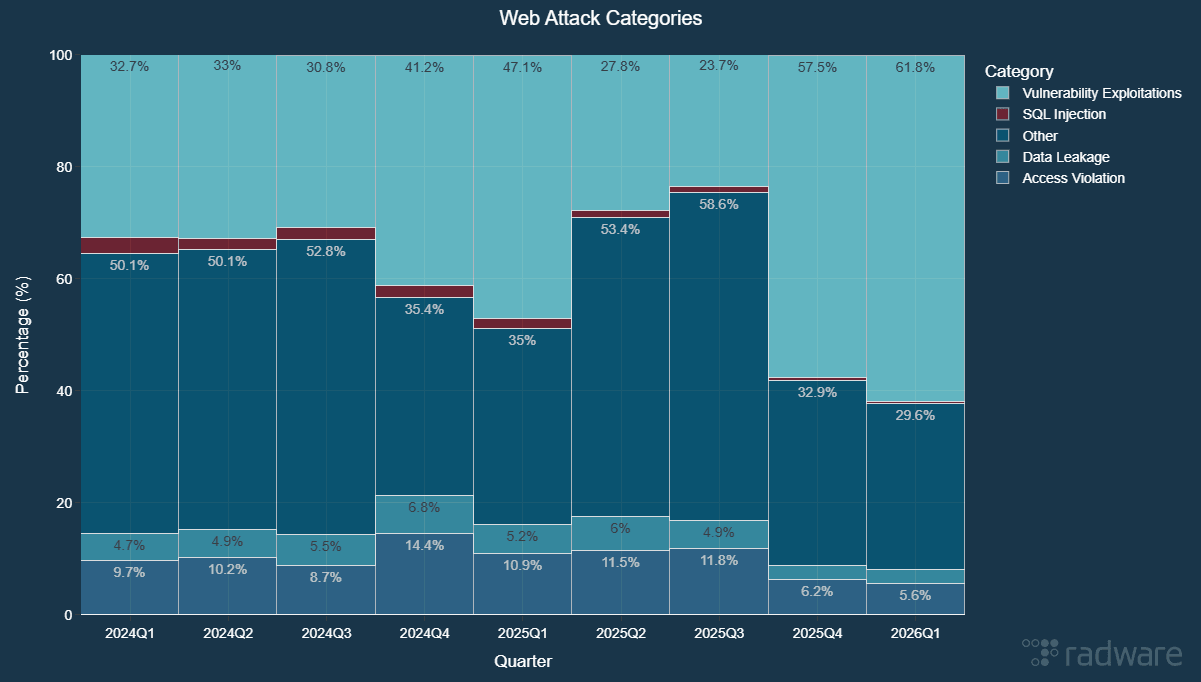
Figure 12: Evolution of web application and API attack categories – normalized (source: Radware)
Looking at the month-by-month progression of web application and API threats, vulnerability exploitations reached an unprecedented peak in March 2026. During this single month, our cloud services successfully blocked over 6 billion exploitation attempts, marking an all-time high for this type of malicious activity.
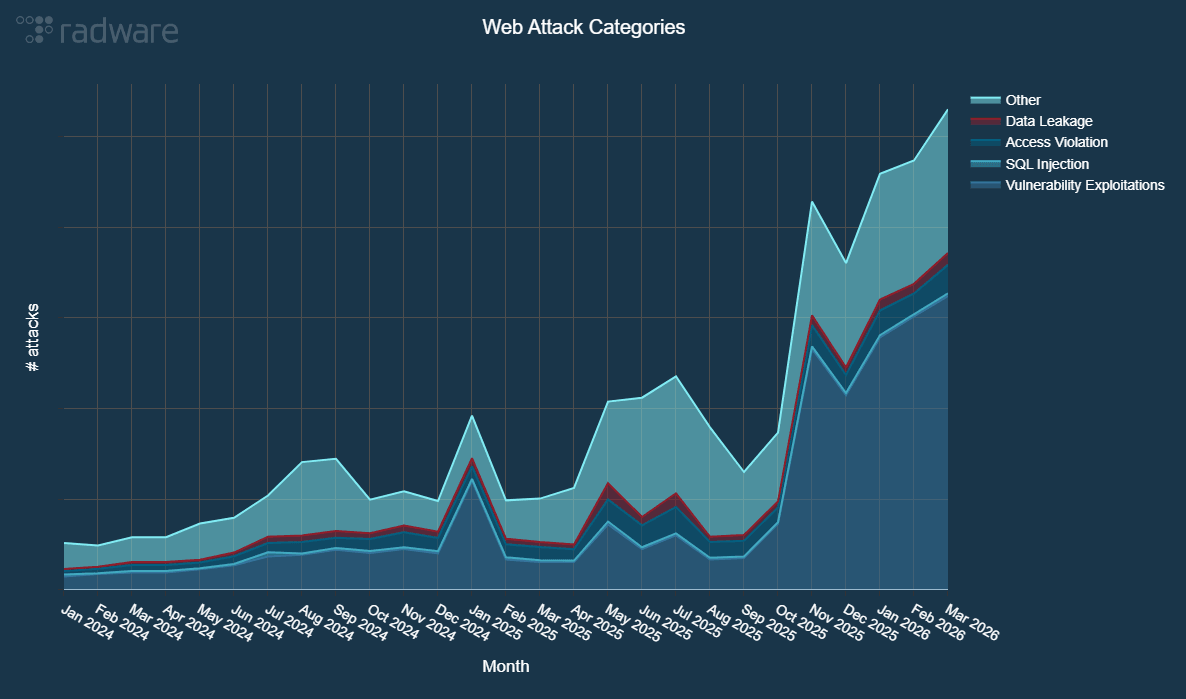
Figure 13 - Evolution of web application and API attack categories per month (source: Radware)
It is important to note that SQL injections, access violations, and data leaks show no signs of slowing down. While access violations and data leaks are currently on an upward trend, SQL injection attempts continue to persist at a steady volume, fluctuating between 50 and 60 million attacks per month.
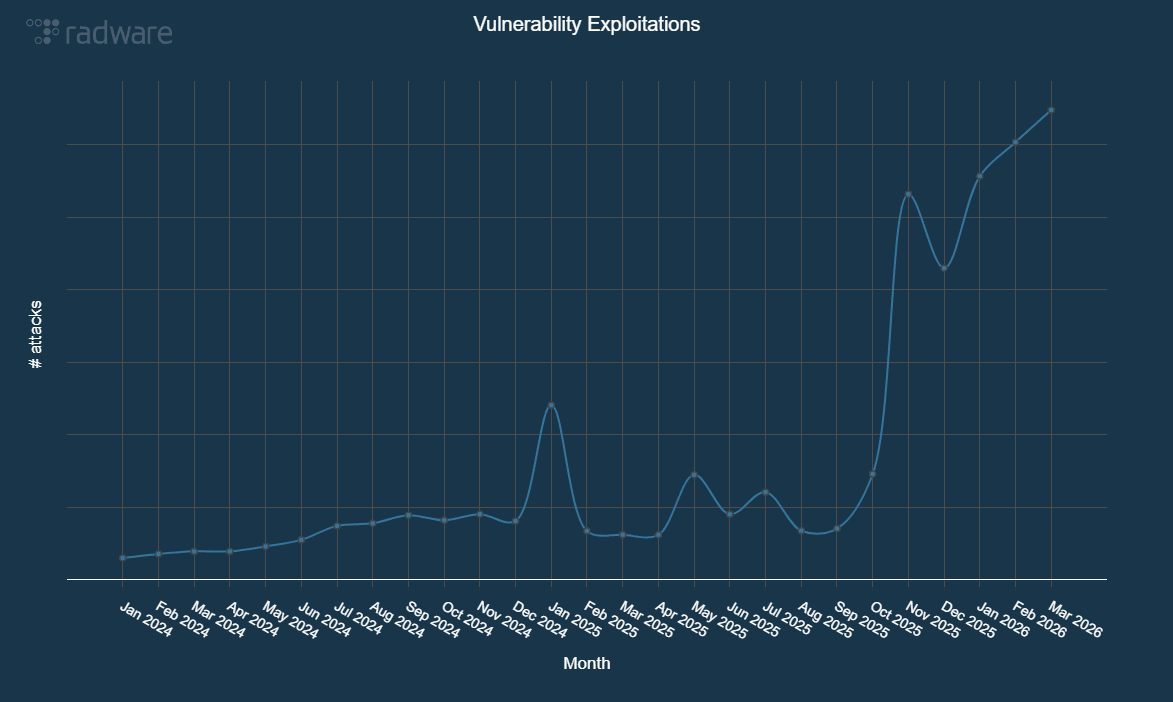
Figure 14 - Evolution of vulnerability exploitations blocked per month (source: Radware)
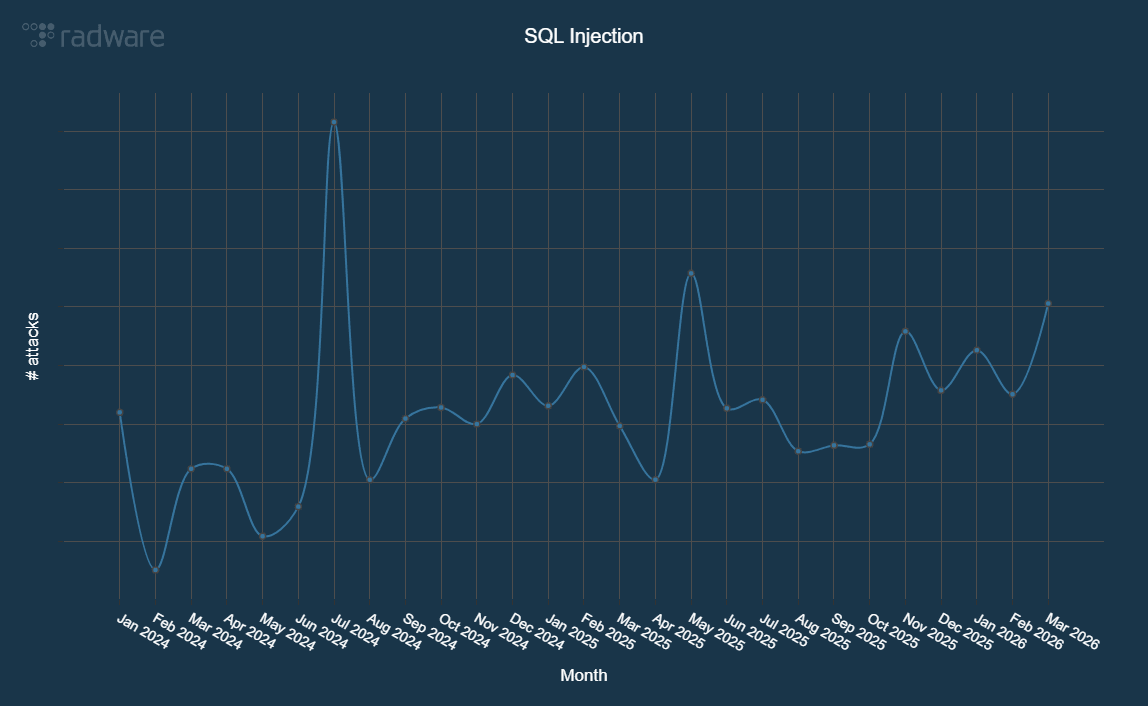
Figure 15 - Evolution of SQL Injection attacks blocked per month (source: Radware)
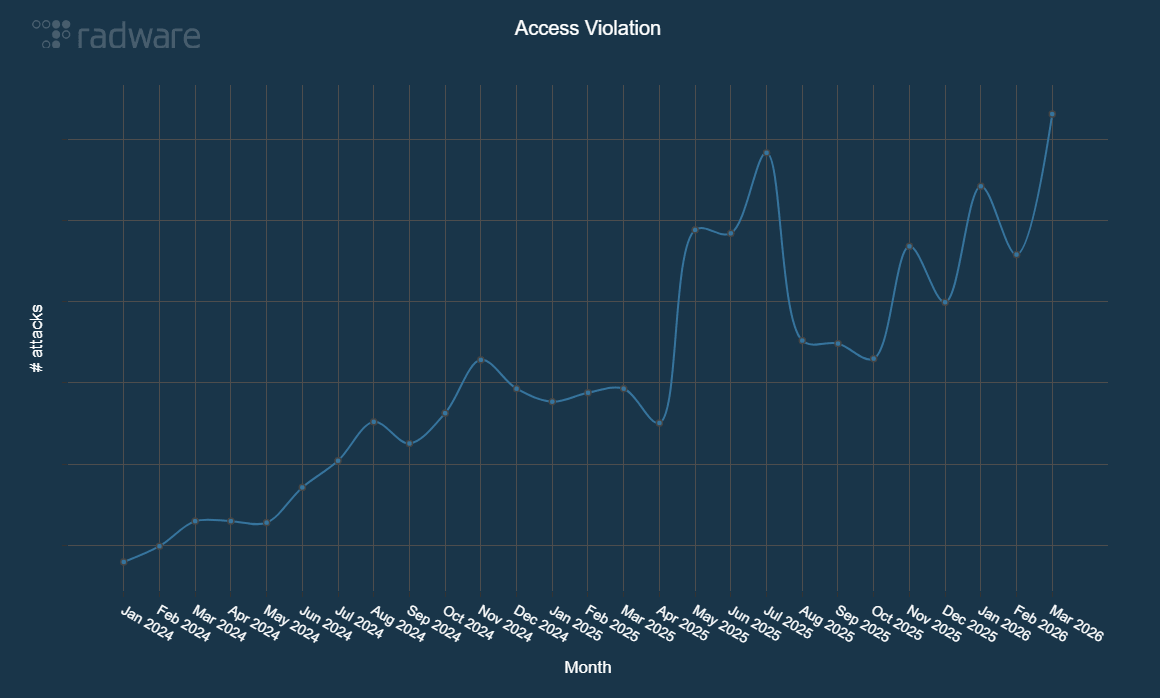
Figure 16 - Evolution of access violations blocked per month (source: Radware)
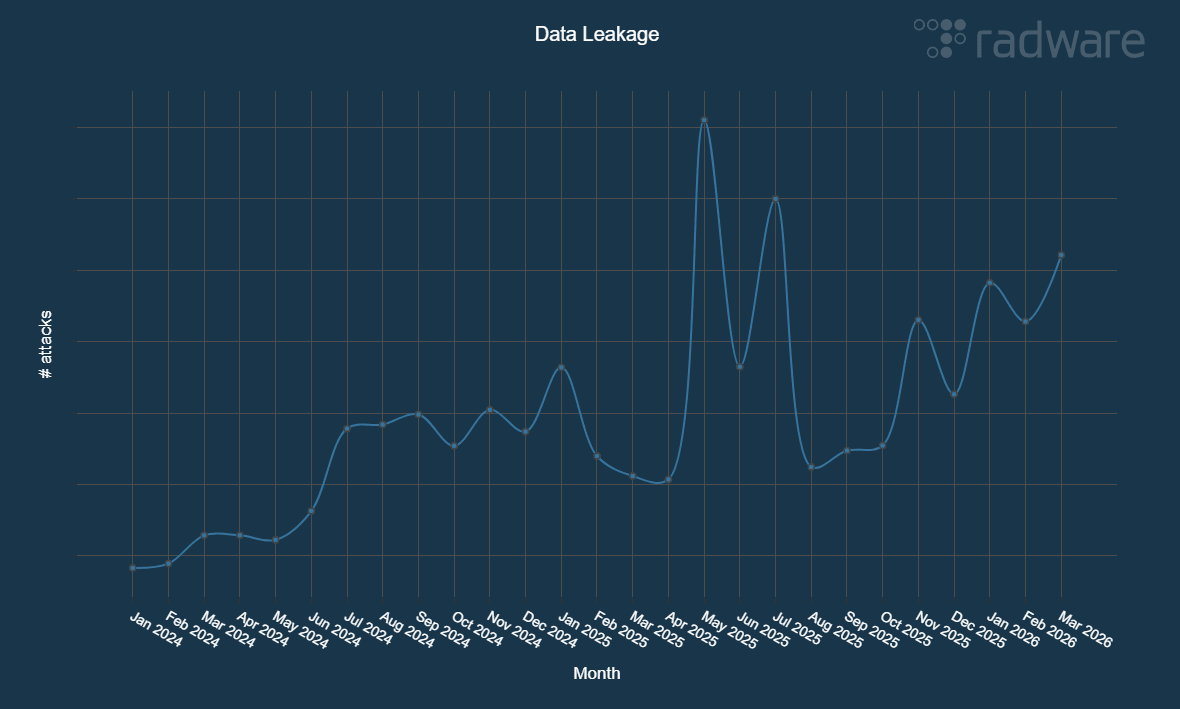
Figure 17 - Evolution of data leakage events blocked per month (source: Radware)
In the first quarter of 2026, North America emerged as the most targeted region, accounting for 80% of all blocked web and API transactions—an increase from its 73% share in 2025. During the same period, EMEA and APAC represented 10.6% and 5.16% of global activity, respectively. Meanwhile, CALA accounted for 4.1% of the total volume, nearly doubling its share compared to the previous year.
Bad Bot Activity
Automated threats surged throughout 2025, with bad bot transactions increasing by 91.8% compared to the previous year. This nearly doubling of the number of bad bot transactions represents a significant acceleration in bot activity when compared to the 35.2% growth observed in 2024 and the 26.2% increase in 2023. In the first quarter of 2026, the attacks remained at similar levels with a slight 4.84% increase compared to Q4 2025 and a more significant 38.37% increase compared to Q1 2025.
The data suggests that bots and automated attacks have reached a new maturity level, with attackers no longer running simple scripts but deploying coordinated bot networks to conduct scraping, account takeover and inventory hoarding at scale.
Geographically, the distribution of bad bot traffic in Q1 2026 remained mostly similar to the distribution in 2025 with the exception of North America that saw an increase in its share of the attacks from 40.7% to 49.3% while EMEA observed a decrease from 19.1% to 11.4%. CALA and APAC remained mostly at the same share in Q1 with 14.5% of all attacks directed to CALA and 24.8% to APAC. Q1 2026 again highlights the global nature of the bad bot problem.
Hacktivist Threat Landscape
In 2023, threat actors claimed 12,723 DDoS attacks on Telegram, a figure that rose by 20% to reach 15,425 unique claims in 2024. This volume stabilized in 2025, which concluded with a total of 16,000 unique claims. Q1 2026 saw hacktivists claim 2,728 attacks, a marginal decline from the final quarter of 2025. Q1 2026 reflects a broader trend of gradual quarterly decreases observed since Q2 2025. Despite this downward trajectory, hacktivism remains an important threat that cannot be overlooked, particularly in regions with active or lingering conflicts.
In Q1 2026 we observed 2,728 DDoS attack claims from 47 threat groups, targeting 1,230 organizations in 77 countries.
Governments were most targeted, representing over 41% of the attack claims, followed by manufacturing, business services, transportations and finance.
NoName057(16) was the most active threat group, representing 33% of all attack claims. Other notable threat groups in Q1 2026 were Keymous+, DieNet, 313 Team, Conquerors Electronic Army, Hider Nex, ServerKillers, RipperSec, BD Anonymous and RuskiNet.
Israel was the most targeted country in Q1 2026. Ukraine was second most targeted, followed by the United States, Denmark, Germany, UK, Kuwait, Spain, Poland and the Czech Republic.
European organizations were the target in 43% of the attack claims while the Middle East represented 35%. Asian and North American business each were the target of 7.55% of all attack claims. African organizations were the target in almost 3% of the attack claims.
Conclusion
In our 2026 Global Threat Analysis Report that covered the 2025 attack data, I noted that the threat landscape in 2026 demands defenders to abandon the assumptions that have served them for the last decade. The first quarter of 2026 confirms this new direction of unprecedented speed, scale, and sophistication that renders traditional, manually driven defenses insufficient. We have entered an era of automated malice, where the democratized power of AI and the professionalization of cybercrime have fundamentally shifted the power balance.
To survive and thrive in this new reality, a modern defensive posture must be built on three core pillars: - Automation: Humans cannot match the speed of algorithmic attacks that pivot in minutes; defense must be automated to detect and mitigate threats in real-time without intervention. - Scale: Architecture must be capable of absorbing terabit-class floods to match the 30 Tbps attacks observed in the last few months. - Integrated Intelligence: Security solutions must perform sophisticated behavioral analysis to distinguish malicious traffic to cope with the new threats emerging in 2026 from the likes of new frontier models (Anthropic Claude Mythos and the 2026 Cybersecurity Landscape, Anthropic Claude Mythos and the End of Patch Centric Security) and an increasing trend of personal AI agents that followed the public release of OpenClaw by Peter Steinberger.
The critical question for 2026 is no longer about the persistence of the threat, but the agility of the response. Attackers are transitioning to a paradigm of automated and massively scaled agentic warfare. Defenders who fail to evolve from reactive, manual processes to proactive, self-defending architectures risk becoming the next casualty.