TLS Insights and Visibility is a centralized analytics experience designed to help security teams understand, monitor, and control encrypted traffic across their environment.
Today, TLS encryption has become the standard across modern enterprise traffic. As adoption continues to grow, organizations face increasing challenges in maintaining clear visibility into encrypted traffic patterns, server behavior, and emerging risks. Without this visibility, maintaining operational control and responding quickly to potential threats becomes significantly harder. While Defense pro delivers advanced TLS inspection, enforcement, and protection capabilities at the device level, many organizations still face a critical gap: understanding how encrypted traffic behaves across deployments and how it impacts protection policies.
They need a way to see the bigger picture across deployments, quickly understand what is happening, and focus on what matters most.
In this blog, we examine how limited visibility into encrypted traffic impacts day-to-day operations and why raw TLS data alone is insufficient. We’ll walk through the UX challenges of the previous experience and show how a more intuitive, centralized approach can turn fragmented TLS metrics into clear, actionable insight.
The Challenge: Visibility Without Operational Context
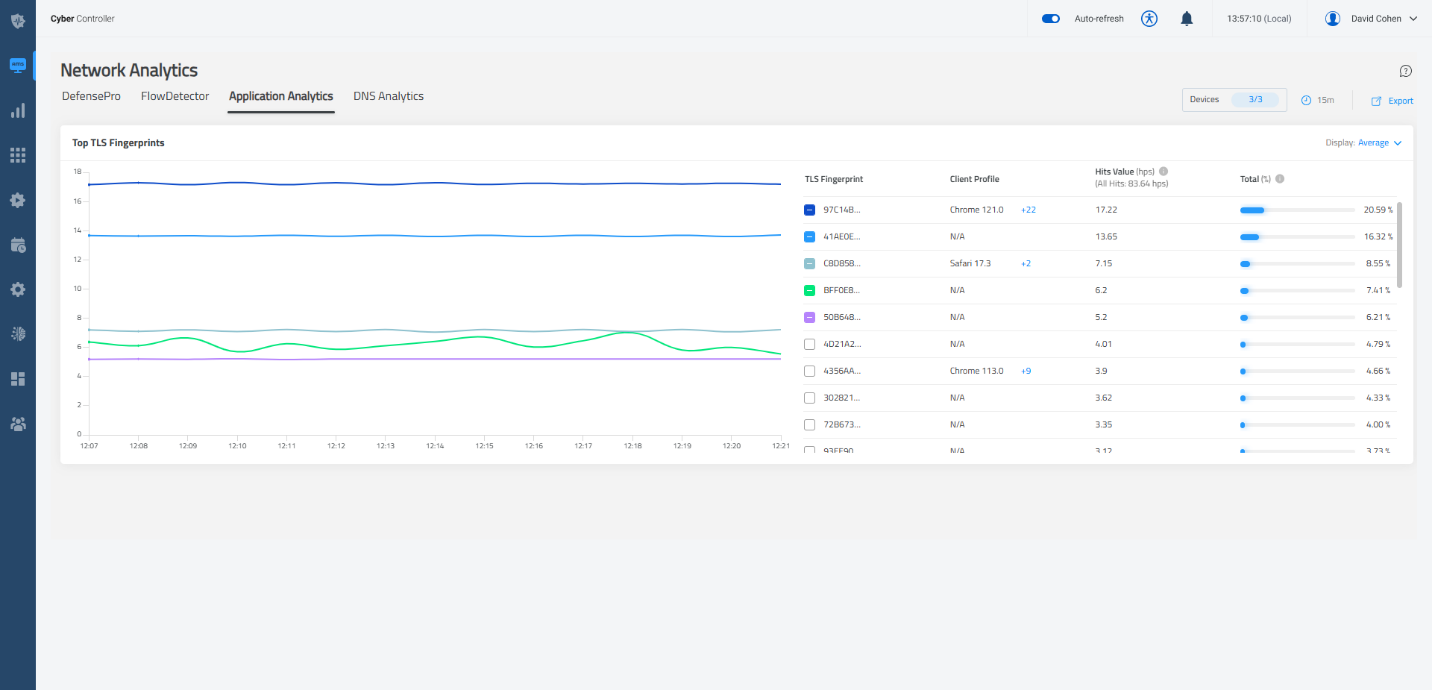
In its previous form, TLS visibility focused on isolated data points such as TLS fingerprints, offering only a narrow view into encrypted traffic activity.
Organizations had access to valuable metrics, but often without the operational context needed to answer key questions: Which servers are under load? Is this behavior expected? Where should attention be directed right now?
The pain point was not a lack of data, but a lack of clarity.
Without clear visibility into encrypted traffic behavior, it becomes harder to fine-tune protection policies, detect anomalies early, and respond effectively to emerging threats.
From a UX perspective, this increased cognitive load and slowed investigations, making it harder for security teams to translate raw TLS metrics into timely operational decisions. For organizations managing large volumes of encrypted traffic, this lack of clarity can also delay response times and reduce operational control.
This challenge highlighted the need for an experience designed to support how security teams monitor, interpret, and act on encrypted traffic.
The Solution: A Centralized TLS Dashboard
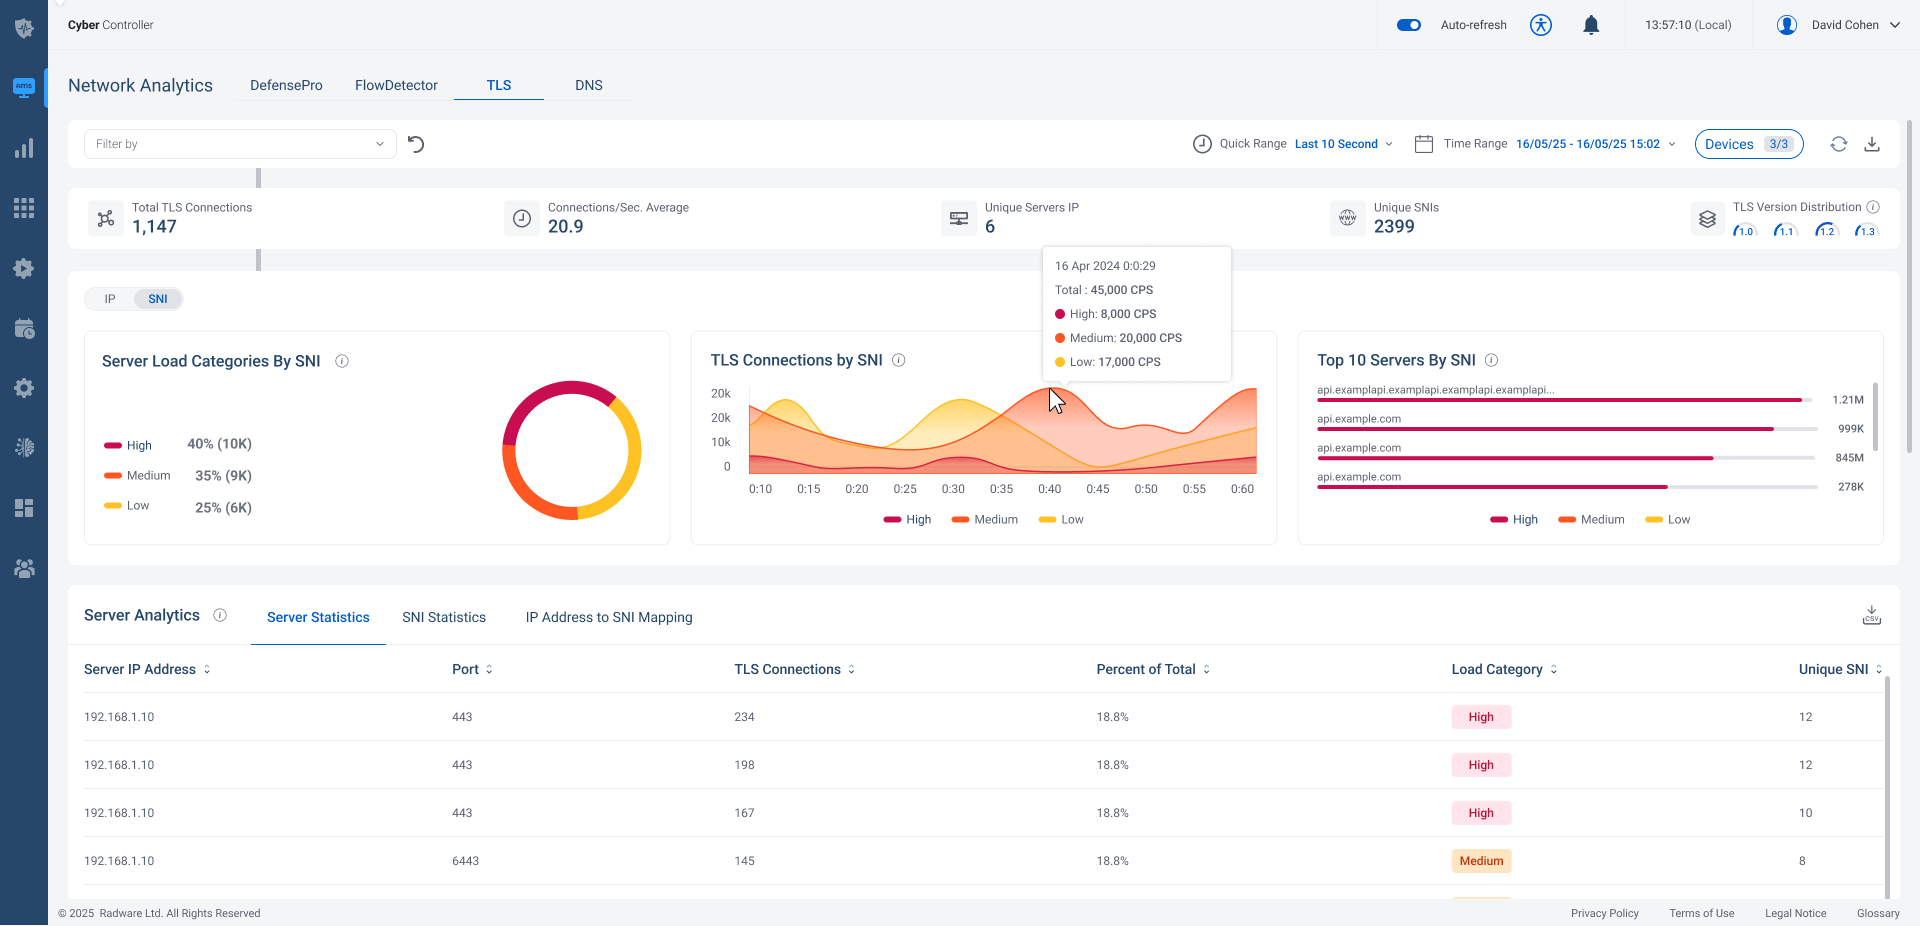
The new TLS dashboard translates this direction into a concrete solution. It brings TLS analytics into a single, unified workspace within Cyber Controller, providing clear visibility into encrypted traffic behavior across deployments.
Instead of navigating between isolated views, this centralized experience presents a comprehensive picture of TLS activity, helping teams understand traffic behavior faster and make more informed operational decisions.
Instant Visibility Through Key TLS Metrics
The dashboard experience begins with a set of clearly defined KPIs positioned at the top of the page. These indicators provide immediate insight into traffic volume, connection rates, and the scope of servers and SNIs involved.
By surfacing this information upfront, the dashboard makes it easier to understand the scale and behavior of encrypted traffic without interpreting complex charts or manually correlating data. This enables faster orientation and prioritization at first glance.
Supporting Investigation Through Visual Structure
Below the KPIs, TLS data is organized to support a natural investigative flow. Traffic trends, distributions, and server-level insights are visually grouped to move from high-level understanding to deeper analysis when needed.
This structure facilitates the identification of anomalies, recognition of patterns, and narrowing of focus without losing context, resulting in a smoother investigation process that aligns with real operational workflows.
Flexible Analysis with IP and SNI Perspectives
Encrypted traffic analysis often requires switching between different perspectives to understand how traffic is distributed across servers and domains. In earlier experiences, gaining these perspectives often meant navigating between multiple views and losing investigative context along the way.
The dashboard addresses this challenge by enabling seamless switching between IP-based and SNI-based perspectives within the same workspace. This makes it easier to explore encrypted traffic from different angles while maintaining investigative context, helping teams identify patterns faster and reach insights without interrupting the investigation flow.
Bringing Clarity to Server Load with Visual Cues
Understanding how TLS traffic is distributed across servers can be difficult when load data is presented only as raw numbers. To address this, the dashboard introduces load categories that visually distinguish between low, medium, and high server loads.
These visual cues make it easier to quickly assess system health and identify where attention is required, especially in dynamic environments. Instead of manually interpreting multiple data points, the system state can be understood at a glance, allowing faster focus on the areas that matter most.
UX That Enables Better Security Outcomes
The new TLS dashboard is not only about presenting data, but about enabling action. By combining structured analytics with an intuitive interface, the experience supports faster investigation, clearer prioritization, and more informed operational decisions.
This UX-driven approach helps improve policy segmentation, optimize mitigation strategies, and strengthen TLS protection by providing the clarity needed to identify abnormal traffic patterns and respond faster to potential attacks.
With clearer visibility and less effort required to interpret TLS activity, organizations can respond more confidently and effectively in complex encrypted environments.
The Value: Clear Visibility, Faster Decisions
TLS Insights and Visibility turn encrypted traffic analytics into an operational advantage, strengthening both visibility and the effectiveness of TLS protection. Instead of working with fragmented metrics and isolated views, organizations gain a single, coherent experience that provides clarity, context, and focus.
This improved visibility strengthens situation awareness, supports faster and more informed decision-making, and enables more effective responses as encrypted traffic continues to grow and operational precision becomes increasingly critical.
Our experts will answer your questions, assess your needs, and help you understand which products are best for your business.