Executive Summary
The first half of 2025 marked a decisive escalation in the sophistication, scale, and persistence of digital threats. Across nearly every attack vector monitored by Radware, cyberthreat activity intensified, led by surges in Web DDoS attacks, application-layer exploitation, hacktivist campaigns, and the aggressive proliferation of bad bots.
Web DDoS attack activity surged by 39% over H2 2024, with Q2 2025 alone witnessing a 54% quarter-over-quarter spike, the highest on record. A clear shift emerged in attack patterns: Rather than relying on massive volumetric assaults, threat actors increasingly favor smaller, sustained attacks under 100,000 requests per second (RPS). This shift signals a growing dependence on automated, generative AI-enhanced attack tools, reflecting the democratization of DDoS capabilities among loosely coordinated threat actors and new actors entering the scene. Despite the lower average attack size, peak attacks reached 10 million RPS, signaling that high-end capabilities remain accessible to the most capable adversaries. Regionally, EMEA continued to absorb the lion’s share of these attacks, while APAC exposure grew noticeably.
Though overshadowed by application-layer trends in recent years, network-layer (L3/L4) DDoS attacks roared back in H1 2025—up 85.5% compared to H2 2024 and 50.3% over H1 2024. By Q2 2025, the average Radware customer faced 7,281 mitigation events per quarter, a 485% increase from Q1 2022. North America accounted for nearly half of all network DDoS activity, with volumetric floods predominantly driven by UDP-based vectors. Amplification attacks, particularly those using DNS and NTP, generated the majority of the attack volume, while SIP protocol targeting stood out as a key risk to VoIP and communications infrastructure.
Hacktivist activity continued to be a steady and significant threat throughout H1 2025. Nearly 9,200 DDoS attacks were claimed on Telegram, representing a 62% increase over the first half of 2024, with 5,011 claims in Q2 alone. This sustained frequency reflects a maturing ecosystem where reposting and coordination among hundreds of Telegram channels amplify campaign visibility. Europe remained the top target (45% of claims), followed by Asia and the Middle East. Israel, the U.S., and Ukraine topped the list of most-targeted nations. NoName057(16) retained its dominance as the most active hacktivist group, responsible for nearly 40% of all claims, followed by Keymous+ and Mr. Hamza. Government services remained the primary sectoral focus (39% of all attacks), but manufacturing, finance, and education were also notably affected.
The rise of application-layer attacks also continued unabated. In the first half of 2025, Radware’s Cloud WAF detected a 33% increase in malicious transactions compared to the second half of 2024. Notably, the volume of malicious activity observed in the first six months of 2025 already accounts for 87% of the total recorded throughout 2024. This solidifies the application layer as the central battleground in the modern threat landscape. Vulnerability exploitation accounted for over one-third of all attacks, while access violations and brute-force discovery techniques represented a growing threat. Although SQL injection incidents declined, this reflects a shift in adversary tactics toward more sophisticated and less detectable methods.
Automated threats powered by bad bots surged dramatically, closely mirroring the trajectory of application-layer attacks. Bad bot activity grew by 57% in H1 2025 compared to H2 2024—nearly reaching 90% of the total 2024 volume in just six months. This increase underscores the growing role of bots in fraud, credential stuffing, data scraping, and digital disinformation. North America was the most targeted region (33.8%), followed by the APAC region (27.2%) and the EMEA region (24.2%). The use of increasingly capable botnets and AI-assisted automation has made defending against these bots more challenging than ever.
Web DDoS Attack Activity
Web DDoS attacks surged by 39% in the first half of 2025 compared to the second half of 2024. Following three consecutive quarters of relatively stable activity, Q2 2025 saw a sharp increase of 54% over Q1, marking a new high in Web DDoS attack activity.
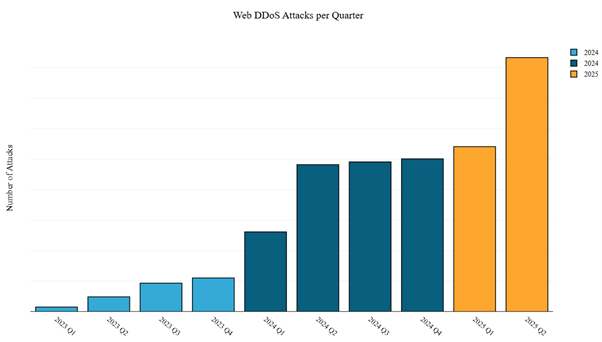
Figure 1: Web DDoS attack activity per quarter (source: Radware)
In the first half of 2025, Web DDoS attacks were predominantly under 100,000 requests per second (RPS). Unlike 2024, which was characterized by larger, high-intensity attacks, 2025 saw a shift toward more frequent but lower-volume incidents. This trend reflects the growing influence of threat groups leveraging open-source tools and generative artificial intelligence (GenAI), making Web DDoS the preferred method of attack in the evolving DDoS landscape.
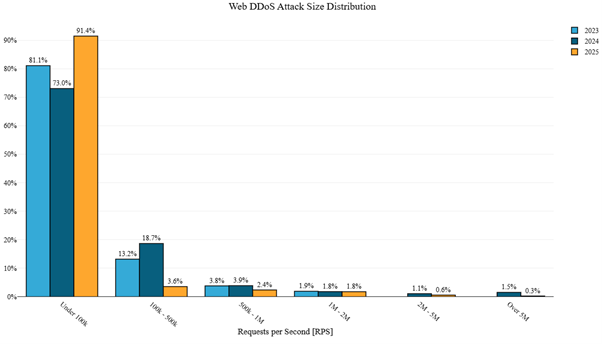
Figure 2:Web DDoS attack size (RPS) distribution per year (source: Radware)
In the first half of 2025, the largest Web DDoS attack reached 10 million RPS in Q1 and 6.2 million in Q2. These figures represent a significant rise compared to the typical peak attack volumes—consistently below 4 million RPS—that prevailed through June 2024.
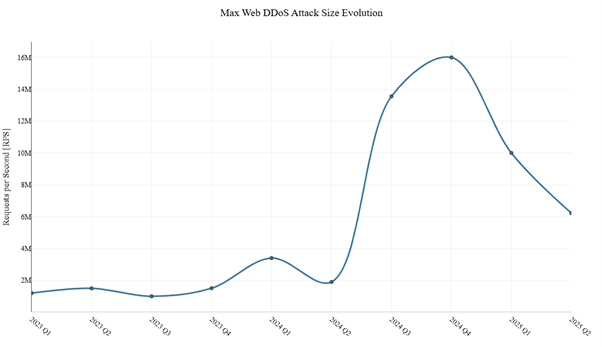
Figure 3: Evolution of peak Web DDoS attack sizes over time (source: Radware)
EMEA continued to be the primary target for Web DDoS attacks in the first half of 2025, accounting for over half of all incidents. The APAC region experienced an uptick in Web DDoS targeting compared to 2024, while North America saw a decline in activity relative to the previous year.
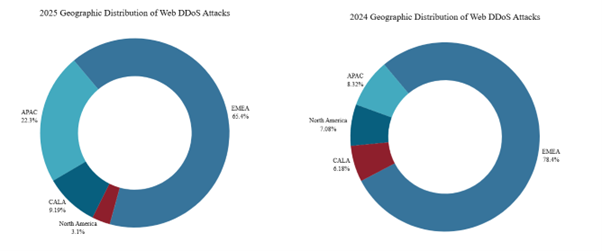
Figure 4: Geographic distribution of Web DDoS attack activity in 2025 and 2024 (source: Radware)
Network DDoS Attack Activity
While the surge in encrypted L7 web application attacks has garnered significant attention over the past three years, it’s important not to overlook developments in network DDoS attacks. Although L3/L4 attacks haven’t experienced the same explosive growth in 2024, there has been a notable increase in their frequency in the first half of 2025, up 85.5% compared to the second half of 2024 and 50.3% higher than the same period last year.
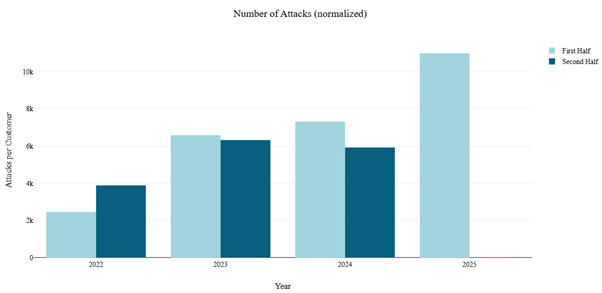
Figure 5: Evolution of network DDoS attacks per half year, normalized per customer (source: Radware)
In Q1 2022, our cloud protections mitigated an average of 1,244 network DDoS attacks per customer per quarter. By Q2 2025, that number had surged to 7,281, representing a 485% increase.
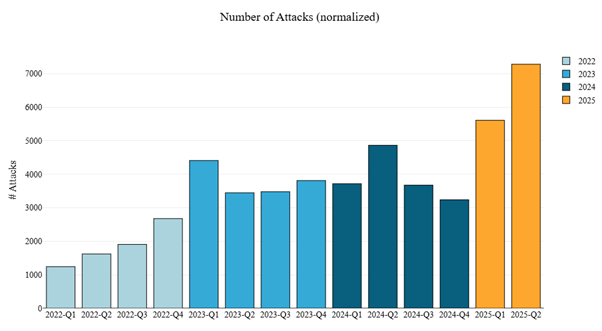
Figure 6: Evolution of network DDoS attacks per quarter, normalized per customer (source: Radware)
North America, targeted by almost 46% of all network DDoS attacks, bore the brunt of the network DDoS activity. Europe came in second with 28%, followed by the Middle-East (12%), Asia (7%), Latin America (3.3%), Oceania (3.0%) and Africa (1.3%).
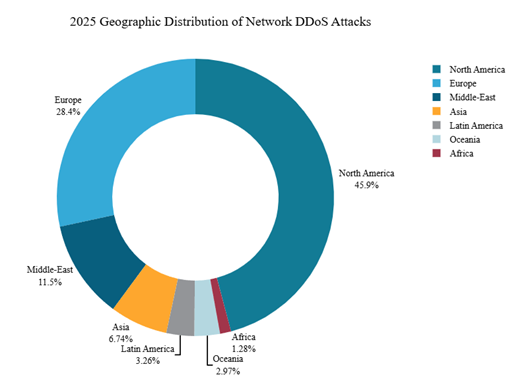
Figure 7: Geographic distribution of network DDoS attacks in 2025 (source: Radware)
Volumetric network DDoS attacks were primarily driven by UDP floods, while resource exhaustion attacks were largely characterized by floods using specific TCP flag packets.
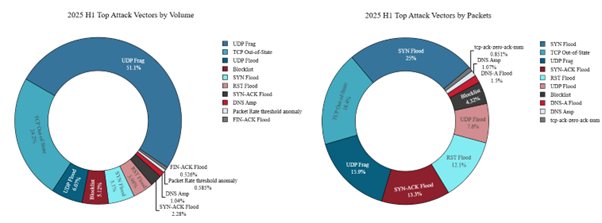
Figure 8: Top network DDoS attack vectors (source: Radware)
DNS and NTP amplification generated the most volume in the first half of 2025, representing 89.2% of the total attack volume. DNS amplification was the most frequently leveraged amplification attack vector, accounting for 64.5% of the observed amplification attack volume in the first half of 2025. SSDP amplification accounted for nearly 10% of the amplification attack volume.
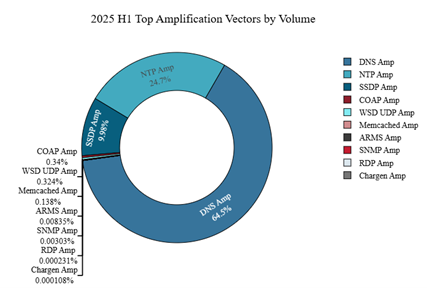
Figure 9: Network DDoS amplification attack vectors by volume (source: Radware)
HTTPS, DNS and SIP were the most targeted protocols, both in terms of volume and packets. DNS and HTTPS form the cornerstone of online applications and APIs. The Session Initiation Protocol (SIP)—a signaling protocol used for initiating, maintaining and terminating communication sessions that include voice, video and messaging applications—was the third most targeted application protocol in the first half of 2025. SIP is used in internet telephony, private IP telephone systems and mobile phone calling over LTE (voice over LTE or VoLTE). SIP is a key protocol and most communications in businesses will grind to a halt when the service becomes unavailable.
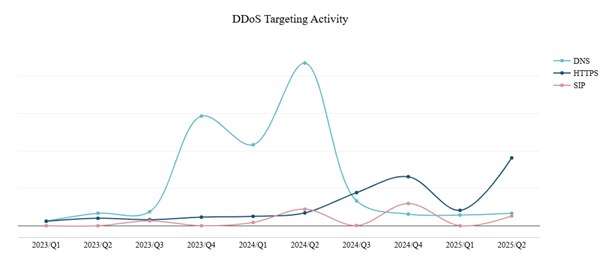
Figure 10: Top targeted protocols (source: Radware)
Hacktivist DDoS Activity
Hacktivist groups frequently post claims of their DDoS attacks on Telegram, often providing evidence by sharing snapshots of website availability through check-host links. These links enable verification of the claimed target as well as the date and time of the attack. By focusing on messages containing valid check-host links, it is possible to monitor claimed attacks on Telegram with greater reliability.
Attack claims posted on Telegram also frequently get forwarded to other channels. Radware only counts the message of the original post in hacktivist reports. This ensures that only unique attack claims—not the number of reposts or forwards—are counted. Figure 11 presents the number of unique DDoS attack claims per month, as well as the total claims across nearly 650 Telegram channels. The total claims include reposts of unique claims. The ratio of reposts of unique claims provides a measure of cooperation among hacktivists who share exploits.
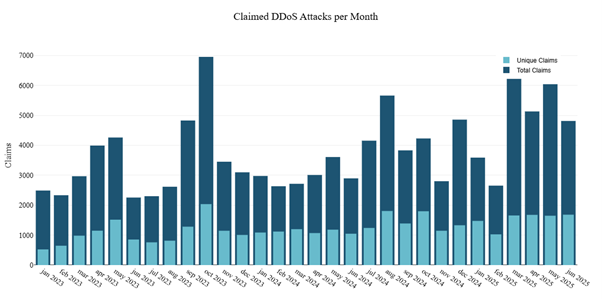
Figure 11: DDoS attacks claimed per month on Telegram (source: Radware)
The hacktivist landscape is a dynamic one: Many groups emerge and just as many fade away. Some groups see their channel banned by Telegram, while others proactively remove a channel to create a new one, thereby clearing out historical data and limiting potential tracking of the channel by authorities and researchers. The overall trend of hacktivist-driven DDoS activity, however, remained largely unchanged throughout the first half of 2025, with approximately 1,600 claimed DDoS attacks reported per month.
In 2023, threat groups claimed 12,723 DDoS attacks on Telegram. This number rose by 21% in 2024, reaching 15,424 unique claims. In the first half of 2025 alone, the number increased to 9,172, representing a 62% rise compared to the same period in 2024 and a 90% increase over the first half of 2023. Q2 2025 closed with 5,011 attack claims, more than double the 2,154 attack claims in Q1 2023.
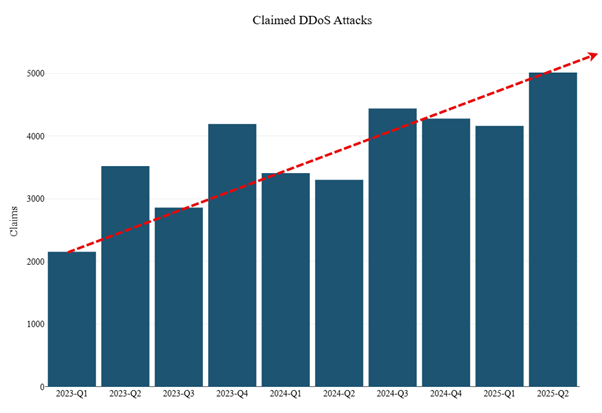
Figure 12: DDoS attacks claimed per quarter on Telegram (source: Radware)
Europe remained the most targeted region in the first half of 2025, accounting for 45% of all DDoS attack claims. Asia followed with 19%, and the Middle East ranked third at 17%. North America trailed slightly behind with nearly 13% of the reported targets. It’s important to note a degree of natural bias in these figures, as the research initially focused on Russian hacktivists attacking Western entities and later expanded to include religiously motivated hacktivists based in Southeast Asia.
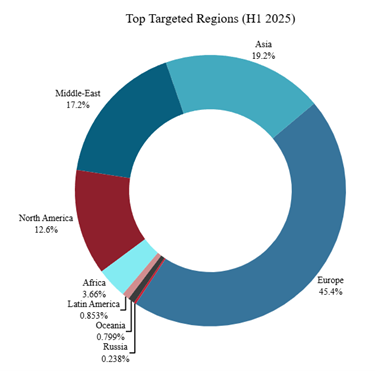
Figure 13: Hacktivist DDoS attack claims per region (source: Radware)
Israel emerged as the top targeted country in H1 2025, representing 13.5% of all claims. The United States followed closely with nearly 12%, then Ukraine (8.6%), France (5.3%), Poland (4.81%), India (4.77%), Italy (4.69%), Vietnam (4.67%), Germany (3.74%) and Thailand (3.22%). Excluding Israel, the U.S., and Ukraine, the distribution among the remaining countries was relatively balanced, underscoring the global scope of hacktivist-led DDoS activity.
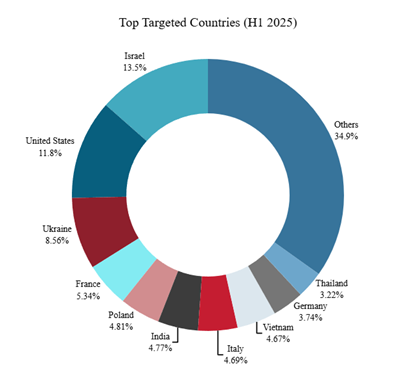
Figure 14: Hacktivist DDoS attack claims per country (source: Radware)
Looking at the broader period from January 2023 through June 2025, Israel remained the most targeted nation, with 4,254 claimed attacks. The United States and Ukraine followed with 3,693 and 3,551 claims, respectively. After that, there’s a notable drop-off, with India receiving 2,427 attack claims, and France, Germany, Poland, Indonesia, and Italy each surpassing the 1,000-claim threshold.
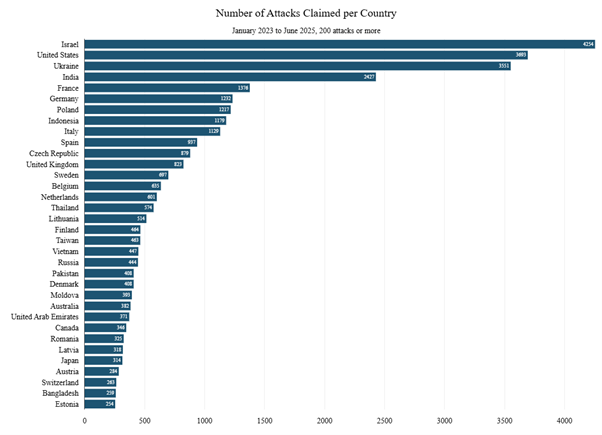
Figure 15: Hacktivist DDoS attack claims per country between January 2023 and end of June 2025 (source: Radware)
Unsurprisingly, NoName057(16) continues to dominate as the most active and prolific claiming threat group in 2025. With 2,534 attack claims—nearly 39% of all claims observed—NoName057(16) remains the primary threat group targeting Western organizations.
Keymous+ ranked second with 777 claims in H1 2025, maintaining a noticeable lead over the next tier of groups: Mr. Hamza (7.61%), RipperSec (7.53%), and Anonymous VNLBN (6.6%). Beyond this top five, the landscape becomes more fragmented, with a broad range of hacktivist groups contributing to the overall activity. These include DieNet, Arabian Ghosts, AnonSec Cambodia, Venom DDoS, AnonSec PS, Vulture, Dark Storm Team, Server Killers, Mysterious Team Bangladesh, and Desinformador Ruso, each playing a role in the increasingly global nature of hacktivist-led DDoS operations.
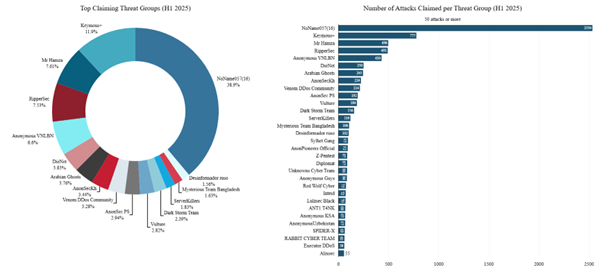
Figure 16: Attacks claimed per threat group (source: Radware)
Governments continued to be the most frequently targeted sector in the first half of 2025, accounting for nearly 39% of all claimed DDoS attacks worldwide. The manufacturing industry followed in second place, representing 9.6% of global activity. Finance (5.83%), education (5.25%), and private businesses (5.16%) closely trailed one another, effectively tying for third place in terms of targets by hacktivist DDoS.
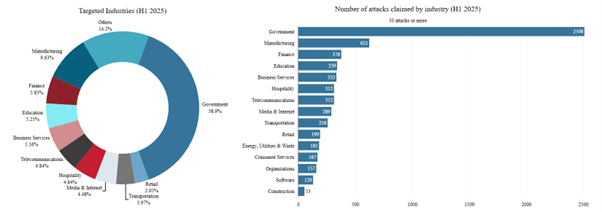
Figure 17: Attacks claimed by industry (source: Radware)
Web Application and API Attack Activity
In 2023, attackers increasingly shifted their focus from the network layer to the application layer. Radware’s Cloud WAF Service detected a dramatic 171% surge in web application and API attacks compared to 2022. This upward trend persisted into 2024, with attacks rising another 41% year-over-year. The momentum carried into the first half of 2025, which saw a further 33% increase compared to the second half of 2024 and a 150% rise over the first half of 2024. The first half of 2025 ended at 87% of the malicious transactions observed in the whole year of 2024, firmly establishing application-layer attacks as the new standard in the evolving threat landscape.
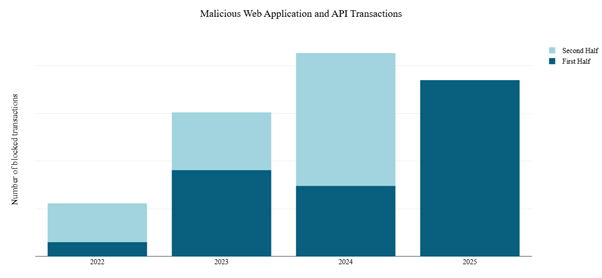
Figure 18: Malicious web application and API transactions per year (source: Radware)
Vulnerability exploitation remained the leading category of malicious web activity in the first half of 2025, accounting for over one-third of all detected threats, a slight increase compared to its share in 2024.
Access violations made up 11.3% of malicious web requests. These attacks typically involve predictable resource location techniques, where adversaries attempt to uncover hidden files or directories by guessing their name. Such brute-force discovery can expose unintended resources, such as outdated backups, configuration files, or unreleased application components.
Data leaks held steady at 5.67% of malicious activity, showing little change from 2024 levels. In contrast, SQL injection attacks declined in prevalence—dropping to 1.47% from 2.17% the previous year—signaling a continued shift in attacker focus toward other, more effective exploitation techniques.
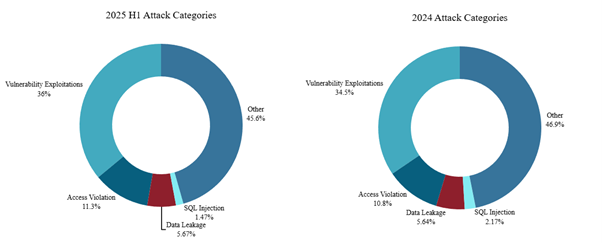
Figure 19: Web application and API attacks by category (source: Radware)
Bad Bot Activity
Bad bots are programs that run automated tasks with malicious intent, including criminal activities such as fraud and theft. Fraudsters, unethical competitors and threat actors from various backgrounds and with differing motivations carry out a wide range of malicious activities and attacks by deploying malicious bots against websites and APIs.
Examples of bad bots are account takeover bots, which use stolen and leaked credentials to access users’ online accounts; web content scraping bots, which copy and reuse website content without permission; social media bots, which spread fake news and propaganda on social media platforms; and scalping bots, which purchase services and products in bulk.
Mirroring the surge in malicious web application and API traffic, bad bot activity has been rising sharply since 2023. That year saw a 26% increase over 2022, followed by a 35% jump in 2024. In the first half of 2025 alone, bad bot transactions reached 89.2% of the total volume recorded in all of 2024—a 57% increase compared to the second half of the previous year. This sharp growth underscores the escalating scale and persistence of automated threats across digital environments.
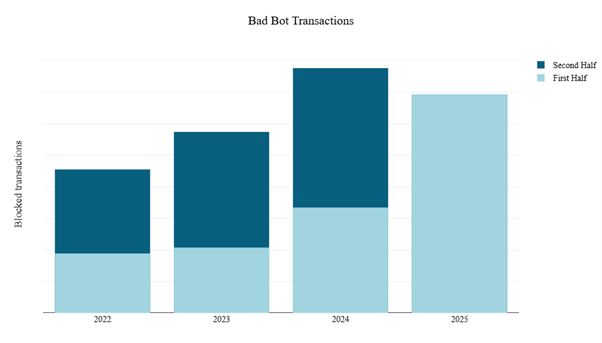
Figure 20: Bad bot transactions per year (source: Radware)
North America was the primary target for bad bot activity in the first half of 2025, responsible for 33.8% of all malicious bot transactions. The APAC region followed with 27.2%, while EMEA accounted for 24.2%. CALA contributed the remaining 14.9% of global bad bot activity.
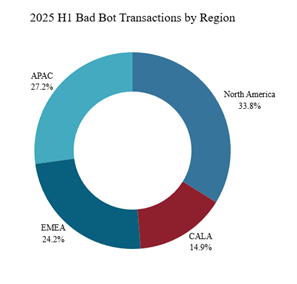
Figure 21: Bad bot transactions per region (source: Radware)
Conclusion
The first half of 2025 has demonstrated that cyberthreats are not only intensifying in volume but evolving in technique. From the rise of smaller, AI-driven DDoS attacks to the normalization of app-layer exploitation and automated fraud via bad bots, threat actors are refining their playbooks for maximum persistence and minimal exposure. Hacktivist DDoS campaigns, often motivated by ideology or geopolitics, have added to the complexity by creating noisy, highly public disruptions.
Across all categories, one common thread is clear: Threat actors are becoming increasingly agile, resourceful, and synchronized. From lone hacktivists to state-aligned groups and AI-assisted adversaries, the lines between cybercrime, activism, and digital warfare are increasingly blurred.
To confront this rapidly changing threat environment, defenders must adopt a multi-layered, intelligence-driven security posture. This includes real-time DDoS detection and mitigation, robust web application firewall (WAF) strategies, anti-bot defenses, and continuous vulnerability management. Moreover, security operations must evolve to incorporate automation, AI, and threat intelligence sharing to match the speed and scale of modern adversaries.
Methodology and Sources
The data for DDoS events and volumes was collected from Radware devices deployed in Radware cloud scrubbing centers and on-premises managed devices in Radware hybrid and peak protection services, jointly denoted as Radware’s Cloud DDoS Protection Service. Note that attack events and blocked events are considered the same for the purpose of this report. All blocked volume is considered attack volume. An attack is a collection of several related attack vectors targeting the same customer and overlapping in time. Events correspond to attack vectors. Attack vectors consist of one or more packets. All packets of an attack vector generate a certain volume expressed in bytes. The volume generated by an attack vector is referred to as the blocked volume for that attack vector, which corresponds to the attack volume for that vector. The attack volume of all attack vectors from the same attack corresponds to that attack’s attack volume.
The data for web application attacks and bot activity was collected from blocked application security events from the Radware Cloud WAF Service. Collected events were based on automatically detected and known vulnerability exploits and exclude any events that might be blocked or reported by custom rules added to a web application policy by managed services and/or customers.
Web DDoS attack details were collected from the ERT SOC incidents relating to the Web DDoS Protection Service.
Hacktivists openly publicize their actions on social media and public Telegram channels to gain media attention and raise awareness. They do not operate covertly or evade the media but instead reveal the names and resources of their targets and attempt to take credit for their attacks. Hacktivists utilize website monitoring tools to demonstrate the impact of their denial-of-service attacks on online resources and frequently share links to reports from online web monitoring tools in their messages. Through tracking and analyzing messages from several active hacktivist groups on Telegram, the Radware Threat Intelligence team can assess the global DDoS activity conducted by hacktivists.